
Figure 6.
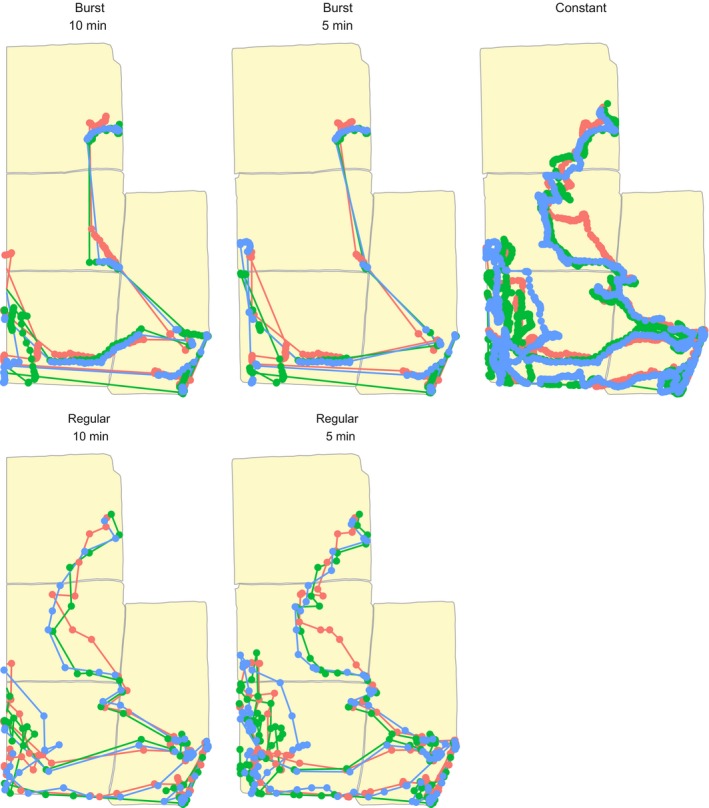
An example of four logging patterns (hourly bursts of 5‐ or 10‐min duration, regular 5‐ or 10‐min intervals) compared to constant logging at 20‐s intervals for three sheep fitted with DIY GPS dataloggers at the Hettinger Research Extension Center, Hettinger, North Dakota. Data are from between 04:00 and 22:00 on 7 July 2017. Pasture divisions represent the patches used to compare space use patterns by the four logging settings (Figure 5). These maps also illustrate how different logging patterns might vary in their estimation of total distance traveled, especially over nonlinear/tortuous routes