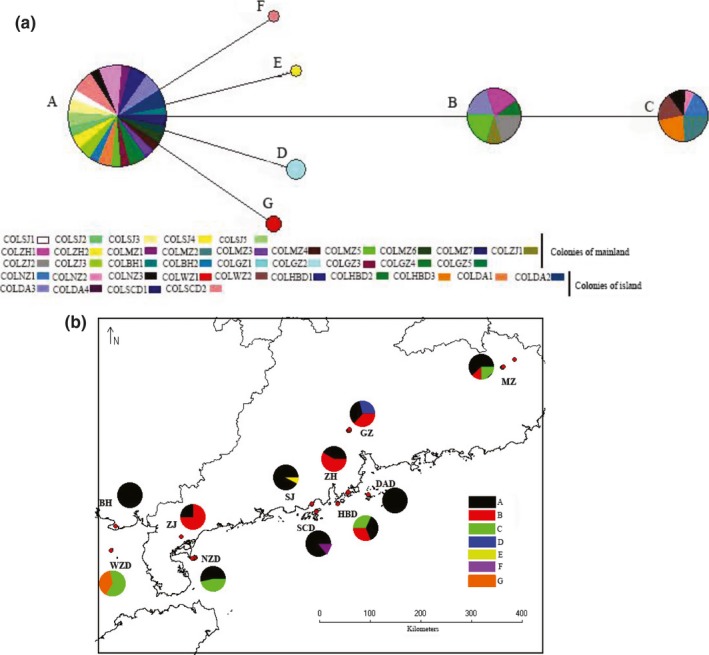
Figure 2.

(a) The distribution of haplotype network of colonies from mainland and island populations. One circle means one haplotype; different colors stand for different colonies; circle size represents the number of the specific haplotype; A, B, C, D, E, F, and G represent haplotype name. (b) The geographic distribution of the haplotypes of mainland and island populations. Different colors stand for different haplotypes. Arcuate area represents the number of haplotypes
