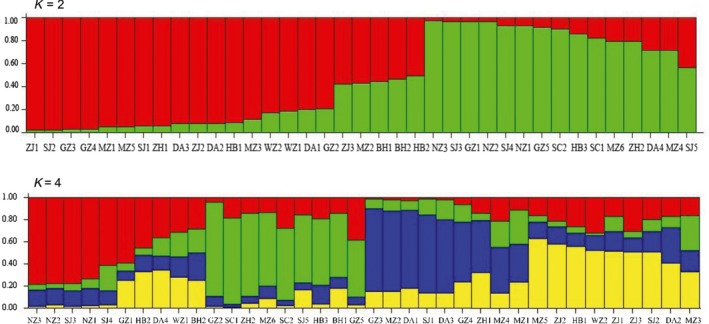
Figure 4.

Colony genetic structure of Tapinoma melanocephalum based on genotypes for K = 2 and K = 4 using the program STRUCTURE. Each individual is represented by a vertical bar. The same color stands for individuals that are assigned to the same cluster
