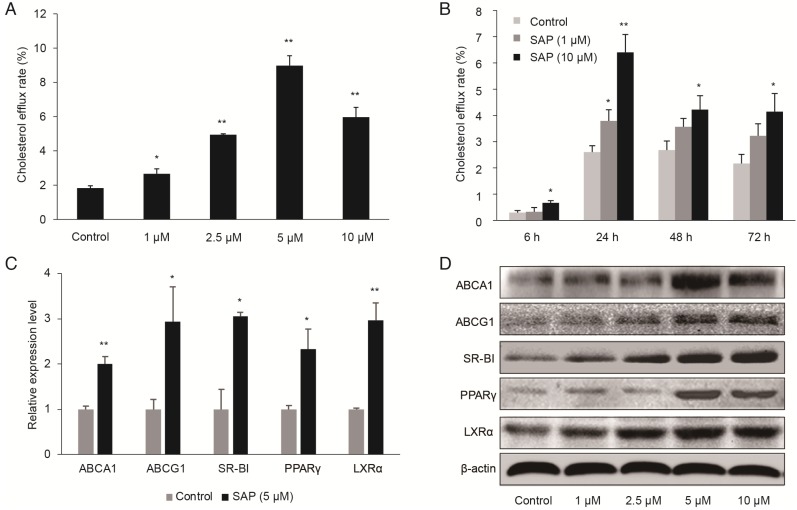
Figure 3.
The role of SAP in macrophages. RAW264.7 cells were treated with different concentrations of SAP. (A) The effect of different concentration of SAP on cholesterol efflux rate in RAW264.7 cells after 24 h treatment (mean ± SEM, n = 4). (B) The effect of SAP on cholesterol efflux rate in RAW264.7 cells across various time points (mean ± SEM, n = 4). *, p < 0.05; **, p < 0.01. (C) The expression of lipid transport-related genes in RAW264.7 cells after SAP treatment for 24 h assessed by qRT-PCR analysis of. (D) Western blot analysis of lipid transport-related genes.

