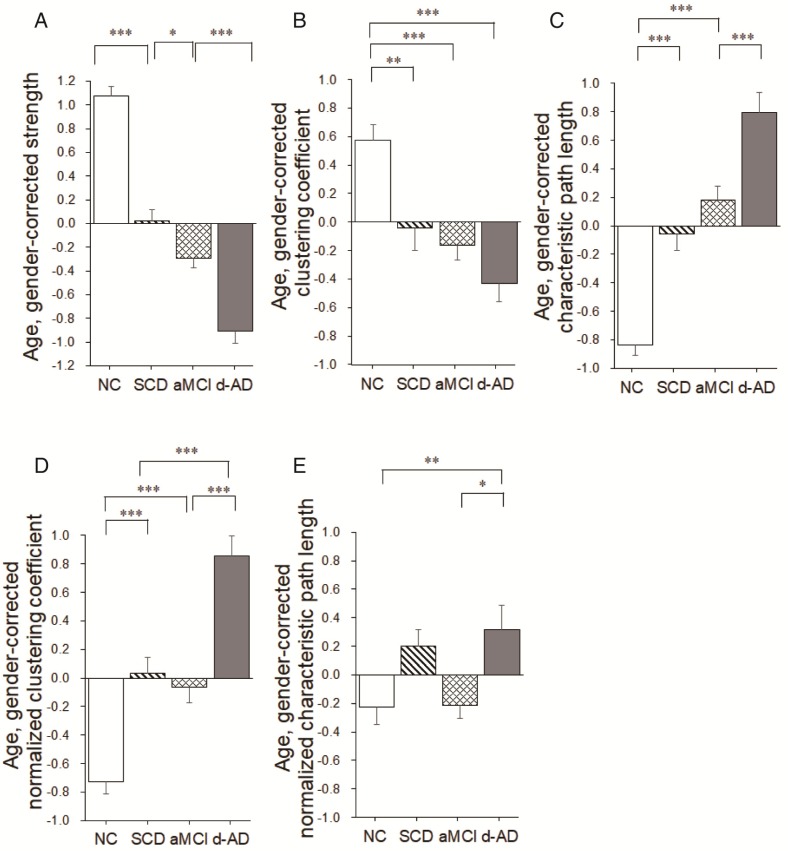
Figure 5.
Group differences in network topological metrics during disease progression. Bar graphs display the mean (standard error) of the age- and gender-corrected metrics of (A) strength, (B) clustering coefficient, (C) characteristic path length, (D) normalized clustering coefficient and (E) normalized characteristic path length (N=224). *P<0.05, ** P<0.01, *** P<0.001.

