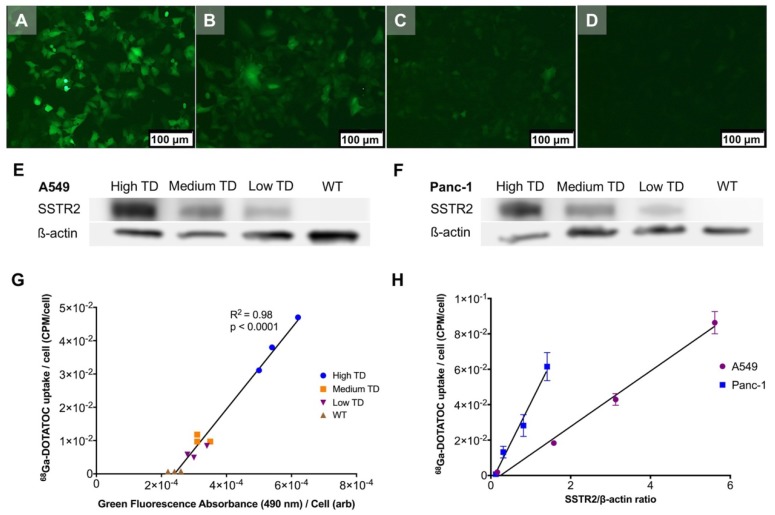
Figure 2.
Correlation between transgene expression and radiotracer uptake. (A-D) Representative fluorescence microscopy images of different A549TD cell clones visually expressing high (A), medium (B) and low (C) GFP levels. A549WT cells (D) demonstrate virtually no fluorescence. (E-F) Western blots of SSTR2 and ß-actin in WT and different clones of TD A549 and Panc-1 cells. The transduction levels were designated based on GFP expression level from fluorescence microscopy. (G) Strong correlation between 68Ga-DOTATOC uptake by different clones of A549 and level of GFP expression based on the intensity of the fluorescence signal (R2 = 0.98, p < 0.0001). (H) Strong correlation between 68Ga-DOTATOC uptake by different clones of A549 and Panc-1 and level of corrected SSTR2 expression (R2 = 0.99, p = 0.0033 and R2 = 0.98, p = 0.0087, respectively).

