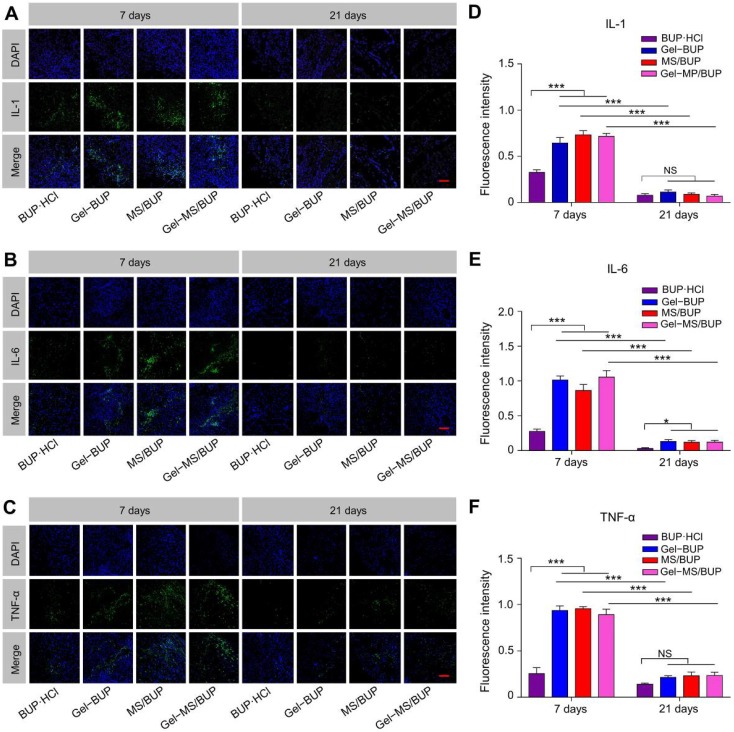
Figure 6.
Qualitative and semi-quantitative analyses of inflammatory factors. (A-C) IL-1, IL-6, and TNF-α staining of sciatic nerve and surrounding muscles for evaluation of inflammatory response 7 and 21 days post-injection. Green fluorescence indicates the inflammatory factors, and blue fluorescence represents the nuclei. Scale bar = 100 μm. (D-F) Semi-quantitative analyses of fluorescence intensity in sections stained for IL-1, IL-6, and TNF-α. Data are presented as mean ± SD (n = 3; *P < 0.05, **P < 0.01, and ***P < 0.001).

