Fig. 1.

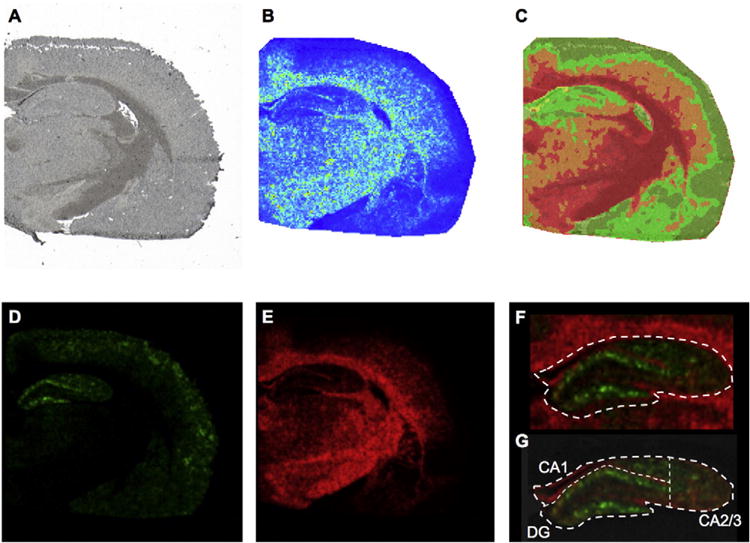
Multivariate Image analysis. (A) High resolution wide field micrograph showing an overview of a half coronal rat brain section used for MALDI IMS analysis. (B) Image of Principal Component 1 (PC1) obtained from Principal Component Analysis (PCA) of the MALDI IMS data. Principal components were used in order to outline the borders of anatomical regions, based on the highest variance in the data set. (C) Segmentation map obtained from multivariate image analysis of the same datadata. Bisecting k-means based clustering analysis identified pseudo-objects (clusters) of mass spectra signals representative of white matter, gray matter and inclusions in the CA1 molecular layer of hippocampus (yellow). (D, E) Correlation of the segmentation map MS data to the full MS revealed molecular ions localizing to the distinctive anatomical regions including (D) ganlioside GM1 (d18:1/20:0, green, m/z 1572.9) and (E) sulfatide ST(d18:1/24:1, red, m/z 888.5). (F) Based on the single ions, identified through segmentation and PCA, the hippocampus was outlined as grey matter region from the adjacent fiber tracts of the corpus callosum, as outlined by the sulfatide signal (ST d18:1/24:1, red). (G) Subregions in the hippocampus were annotated subsequently. Here, the DG ROI was outlined based on the molecular layer of the DG as highlighted by the GM1 d18:1/20:0 (m/z 1572.9) signal. The adjacent, CA1 that was in turn dorsally confined by the white matter and laterally defined by the molecular layer of the DG. The remaining lateral CA region was annotad as CA2 and CA3 ROI.
