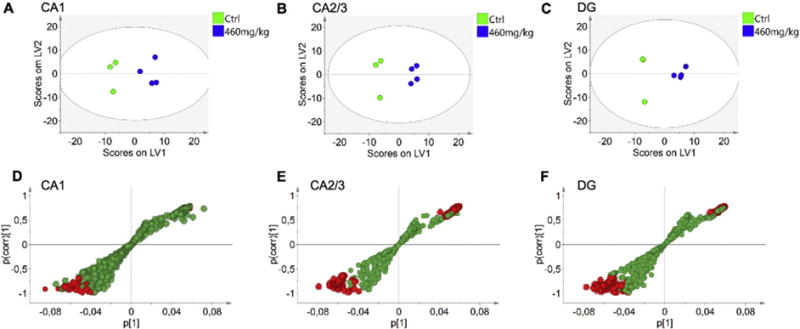
Fig. 2.

Multivariate analysis of spectral data reveals changes in hippocampus of BMAA exposed animals. OPLS-DA models were calculated for three regions of interest, CA1, CA2/3 and DG, using three control and four BMAA exposed animals. (A) For the CA1 region a 1 + 2 (1 predictive + 2 orthogonal components) was obtained. The model explained 75% of the variation in the data set (R2X cumulative) with predictive power of 0.67 (Q2 cumulative). (B) For CA2/3, a 1 + 2 model was calculated which explained 97% variation (R2X cumulative), with a predictive power of 0.94 (Q2 cumulative). The analysis of the DG resulted in a 1 + 2 model that explained 98% variation with a predictive power of 0.91 (C). Two of the animals in this region displayed similar score vectors (see Suppl. Fig. S3). S-plots of the OPLS-DA models allow for visualization of the magnitude (covariance, p [1]) and reliability (correlation, p(corr) [1]) of loading profiles with respect to the component scores in the models. In each of the regions, (D) CA1, (E) CA2/3, (F) DG, the red highlighted circles represent variables that display high magnitude and high reliability with respect to the predictive component scores. These can be identified as putative biomarkers of the two groups, based on 99% confidence interval (see Suppl. Fig. S4).
