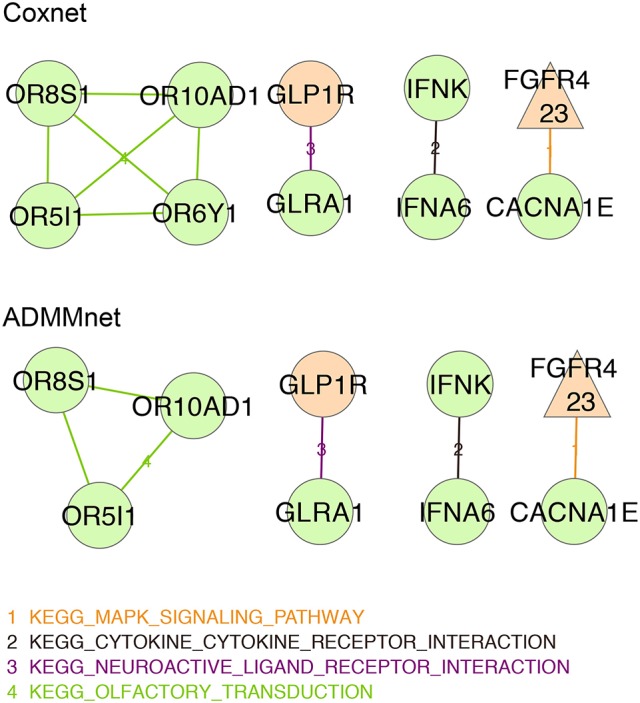
Figure 5.

Integration of mRNA data and CNAs profiles: BMD+DAD-screening network using Coxnet (top) and ADMMnet (bottom) methods with mRNA expression data and the integration of mRNA data and CNAs profiles. Non isolated genes are represented as nodes in the network, then a link a drawn between two (adjacent) genes when the two genes belong to the same KEGG pathway. We use different colors for KEGG pathways and three colors to identify the type gene: orange color for genes-HEFaIMp-high, green color for genes-HEFaIMp-low, purple color for genes-no-HEFaIMp. Triangular-shaped nodes indicate the genes identified in literature as breast-cancer associated genes. The number of papers is also reported in the triangular nodes.
