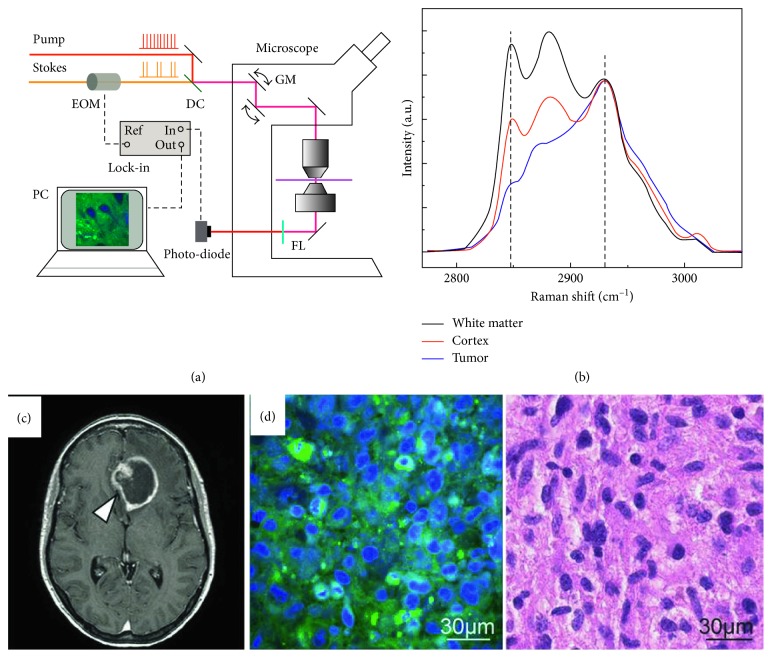
Figure 3.
SRS microscopy delineating glioma infiltration in animal models. (a) System setup; (b) Raman spectra of white matter, cortex, and tumor; (c) MRI image of a mouse brain; (d) SRS and the corresponding H&E image of a glioma tissue. Reprinted with permission from Ref. [65].

