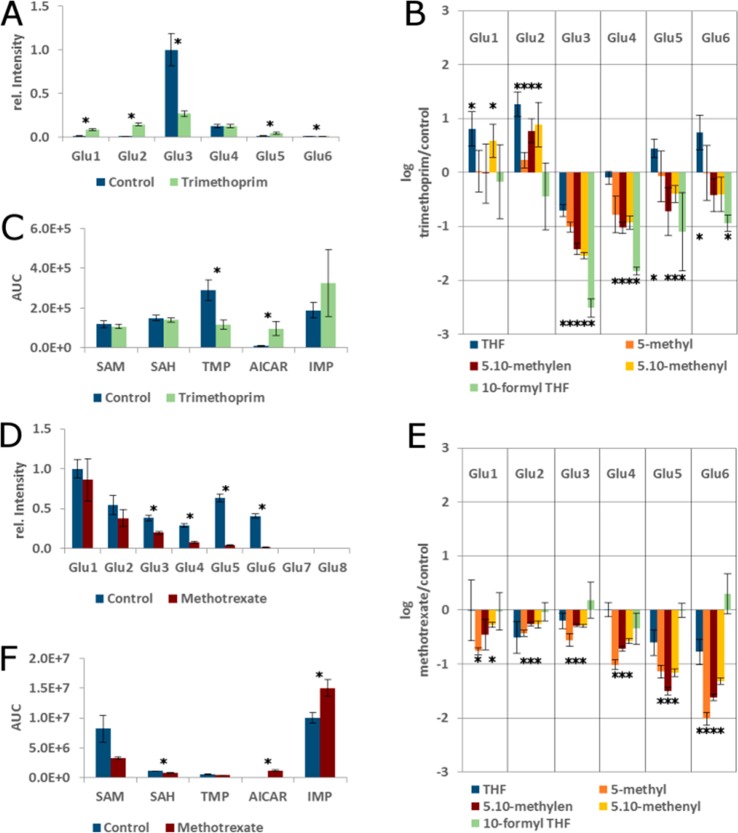
Figure 5.
Effect of DHFR inhibition in bacterial and mammalian systems. (A) Distribution of polyglutamation in control and trimethoprim treated E. coli K12. Peak areas of all folate species with a given polyglutamation number were summed and normalized. (B) Relative changes (log 10-fold) of reduced folates upon trimethoprim treatment of E. coli K12. (C) Selected C1 targets in E. coli. (D) Distribution of polyglutamation in control and methotrexate treated HepG2 cells. (E) Relative changes (log 10-fold) of reduced folates upon methotrexate treatment of HepG2 cells. (F) Selected C1 targets in HepG2 cells. *p < 0.01.

