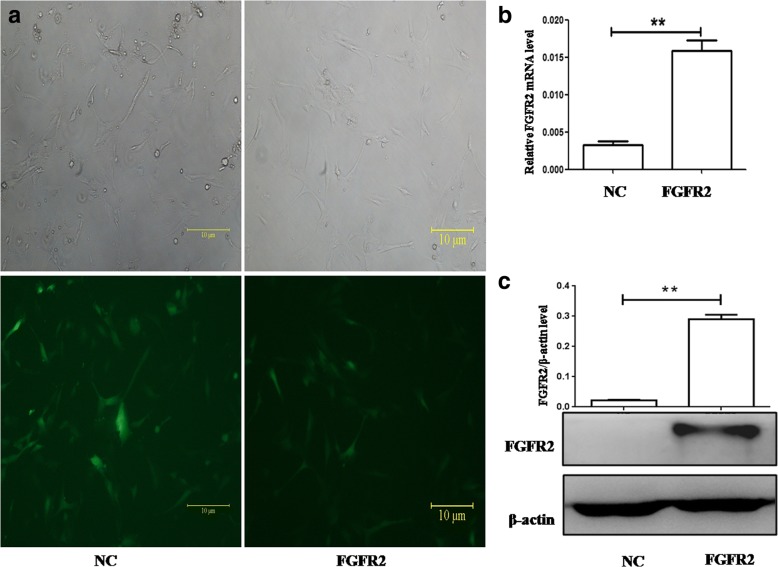
Fig. 1.
Verification of stable cell lines overexpressing FGFR2 or Control (NC). (a). Phase contrast microscopy (up) and fluorescence images (bottom) showed GFP positive hFOB cells in the same field. Panels shown are: (left) cells transfected with control lentivirus; (b) cells with FGFR2 letivirus. FGFR2 expression was detected after these transfected cells were selected with puromycin. FGFR2 expression was examined by real-time PCR (b) and Western blot (c), respectively

