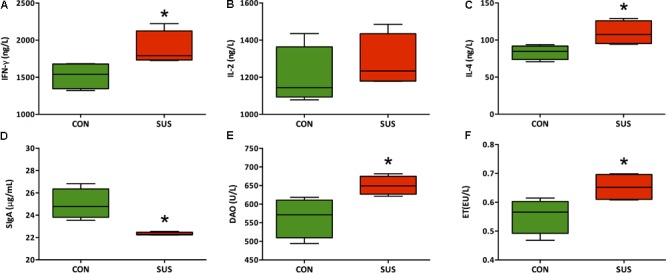
FIGURE 3.

(A–F) Effects of simulated weightlessness on the levels of IFN-γ, IL-2, IL-4, DAO, and ET in serum and SIgA in ileum. CON, control group; SUS, simulated weightlessness group. Data are representative as median with absolute range (min. and max.) and interquartile ranges Q25 and Q75. ∗P < 0.05, compared with the control group.
