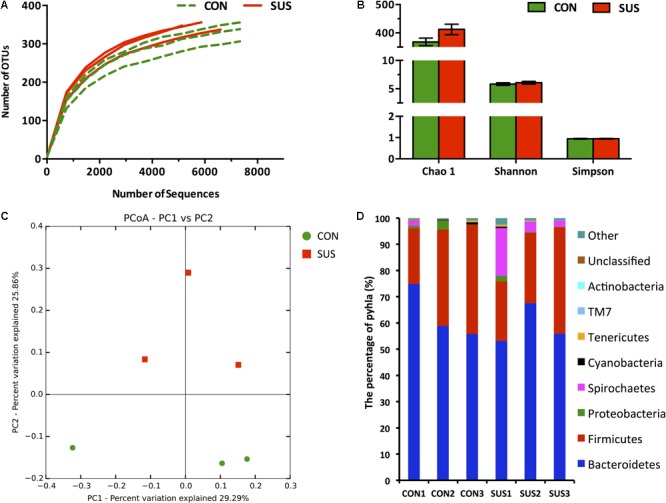
FIGURE 5.

Pyrosequencing analysis of caecal bacteria. (A) Rarefaction curves. (B) Diversity indexes. Values are representative as means ± SEM. (C) Principal coordinates analysis of caecal bacteria at the OTU level. (D) Phylum-level abundance of 16S rRNA gene sequences from the cecum. CON, control group; SUS, simulated weightlessness group.
