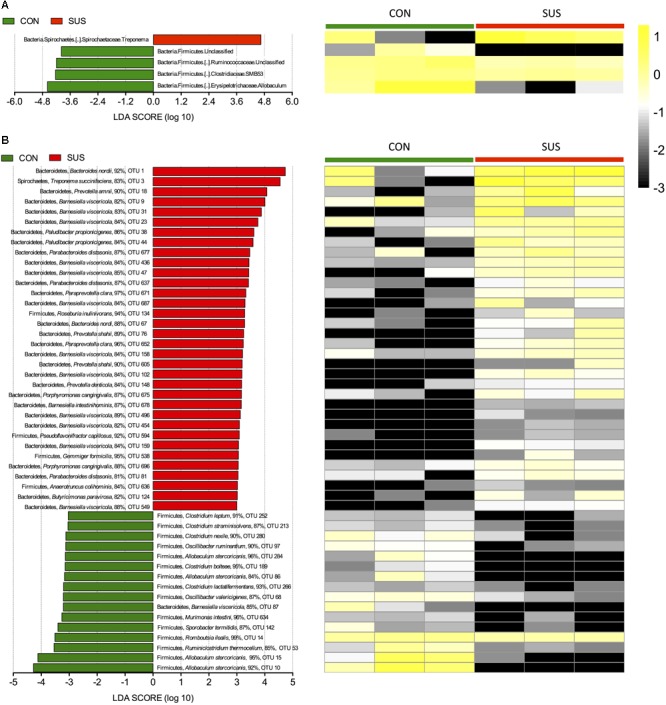
FIGURE 6.

Comparisons of caecal bacteria using LEfSe. The left histogram shows the LDA scores computed for features at the phylum (A) and OTU level (B). The right heatmap shows the relative abundance of phylum and OTU (log 10 transformed). Each column represents one animal and each row represents the phylum and OTU corresponding to left one. CON, control group; SUS, simulated weightlessness group.
