
Fig. 2.
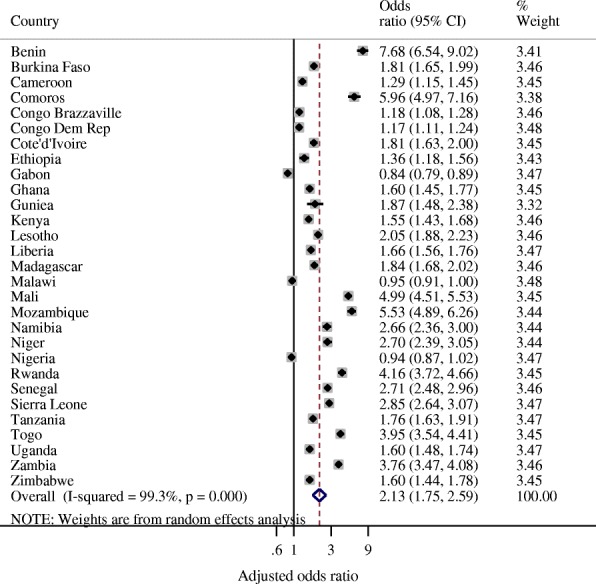
Forest plot of adjusted odds ratios of observing health facility delivery during latest survey rounds compared with earliest survey rounds for 29 sub-Saharan African countries (i.e. 58 surveys)
Official websites use .gov
A
.gov website belongs to an official
government organization in the United States.
Secure .gov websites use HTTPS
A lock (
) or https:// means you've safely
connected to the .gov website. Share sensitive
information only on official, secure websites.
Forest plot of adjusted odds ratios of observing health facility delivery during latest survey rounds compared with earliest survey rounds for 29 sub-Saharan African countries (i.e. 58 surveys)