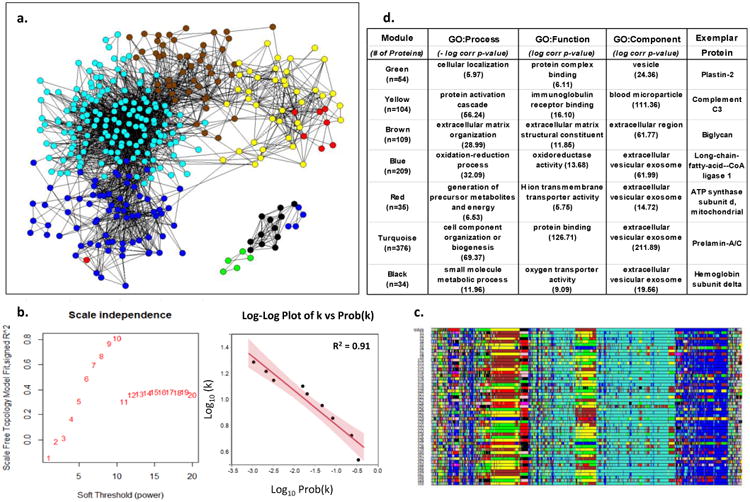
Figure 1. Weighted Co-Expression Network Analysis of Human LAD Proteins.

a. Adjacency map of LAD proteins color coded by module assignment based on hierarchical clustering of the topological overlap matrix (TOM)-based dissimilarity measure. For clarity of presentation only nodes (proteins) with at least one edge (adjacency measure (k)) > 97.5%tile are shown (n-544). b. Left panel shows that scale-free topology is best approximated when the adjacency power parameter β= 10. Right panel shows the log-log plot of adjacency (k) vs prob(k) with β= 10, confirming the power-law relationship in the connectivity of the expressed proteins. c. Module assignment for fifty 90% random samples of the data illustrating the overall stability of the modular structure of the protein expression patterns. Colors are assigned according cluster size which may vary with each random sample. As a result actual color assignment may vary from run to run, but module membership remains relatively stable. d. Top non-redundant GO Terms with Bonferroni corrected p-values and an exemplar protein for each module.
