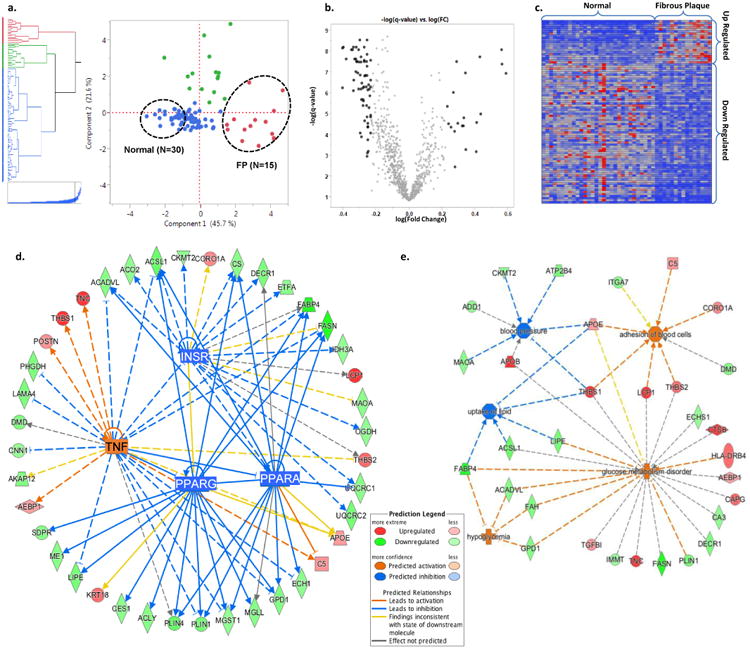
Figure 4. Patho-Proteomic Phenotyping.

a. Hierarchical clustering and principal component score plot of the pathologist grading of extent of FP, FS, and normal tissue combined with CAM-derived estimates of proportion of four different empirical tissue types. Dashed circles indicate samples (2:1) from the extremes of the first principal component which separates fibrous plaques and normal arterial tissue. b. Volcano plot of log(fold change:FP/Normal) vs. -log(t-test q-value) for 944 arterial proteins. Black data points indicate proteins with a fold-change of >1.7 (or < 1/1.7) and a q-value of <0.05. (Two proteins with –log(q-value)>10 not shown.) c. Heatmap of the spectral count values for the N=88 proteins meeting the fold-change and q-value criteria noted in panel b. The individual proteins are listed in Supplementary Tables 8 and 9. d. A combined network map of the significantly up- and down-regulated proteins that are consistent with effects of an upstream master regulator. The observed pattern of proteins in FP are highly suggestive of TNF activation (p=1.64E-6, z-score=3.19), and inhibition of PPAR-α (p=3.55E-10, z-score=-3.06), PPAR-γ (p=2.87E-10, z-score=-3.02), and the insulin receptor (1.41E-12, z-score=-2.16). PPAR-α, PPAR-γ, and the insulin receptor pathways are themselves inhibited by TNF activation. When using >1.5 fold-change criteria, several additional regulatory networks were also identified (e.g. TGFB1, TP53, SP1, MYC). e. Predicted disease processes and their affiliated proteins significantly overrepresented by the up- and down-regulated proteins in fibrous plaques. The data are consistent with major alterations in cell-cell adhesion/interaction (p = 3.64E-03), lipid uptake (p = 1.67E-03), glucose homeostasis (p = 2.83E-06) and blood pressure regulation (p = 3.68E-03).
