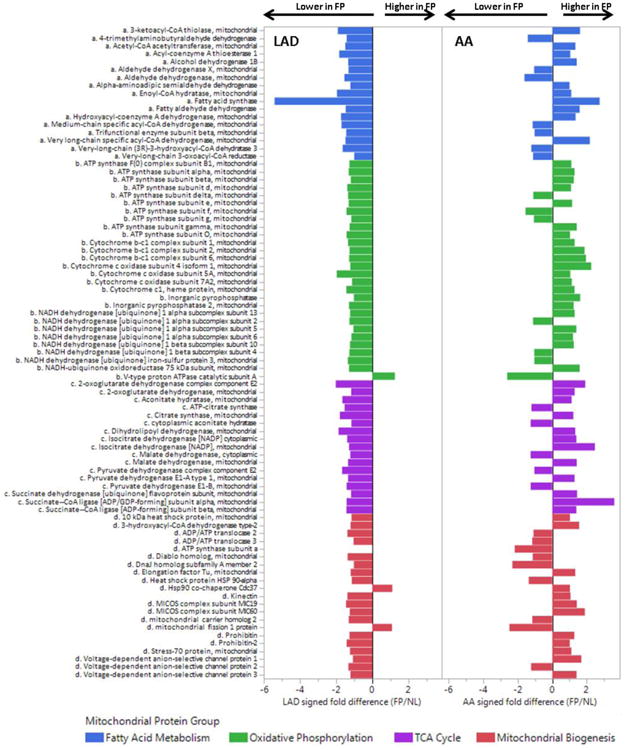
Figure 6. Comparison of Mitochondrial Proteins in FP vs NL Samples from the LAD and AA.

DIA-MS analysis was used to compare a targeted set of mitochondrial proteins in n=15 FP and n=30 NL LAD samples after adjustment for age, sex, MYH11, RABA7A, TERA, G6PI. Histogram bars indicate relative difference ebetween FP and NL samples in each anaotomic location. LAD MANOVA p-values for each mitochondrial protein group: p < 0.0001 for each group; AA MANOVA p-values for each mitochondrial protein group: p= n.s for each group.
