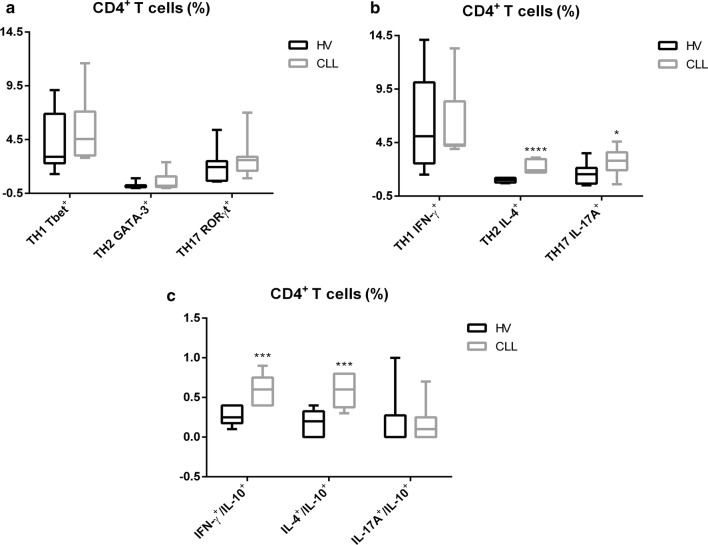
Fig. 2.
Evaluation of CD4+ T cells frequency in peripheral blood of CLL patients. Representative box plots relative to a CD4+ T cell subsets frequency in PBMCs from HV (n = 15) and CLL patients (n = 15); b IFN-γ, IL-4 and IL-17A secretion in CD4+ T cells obtained from HV (n = 15) and CLL patients (n = 15); c IFN-γ, IL-4, IL-17A co-secretion with IL-10 in CD4+ T cells obtained from HV (n = 15) and CLL patients (n = 15); all after in vitro stimulation with IL-6 and PIM. All results are expressed as median and interquartile range. P value shown is obtained from the comparison between the indicated groups by exact non-parametric Mann–Whitney U test (*P < 0.05; **P < 0.01; ***P < 0.001)

