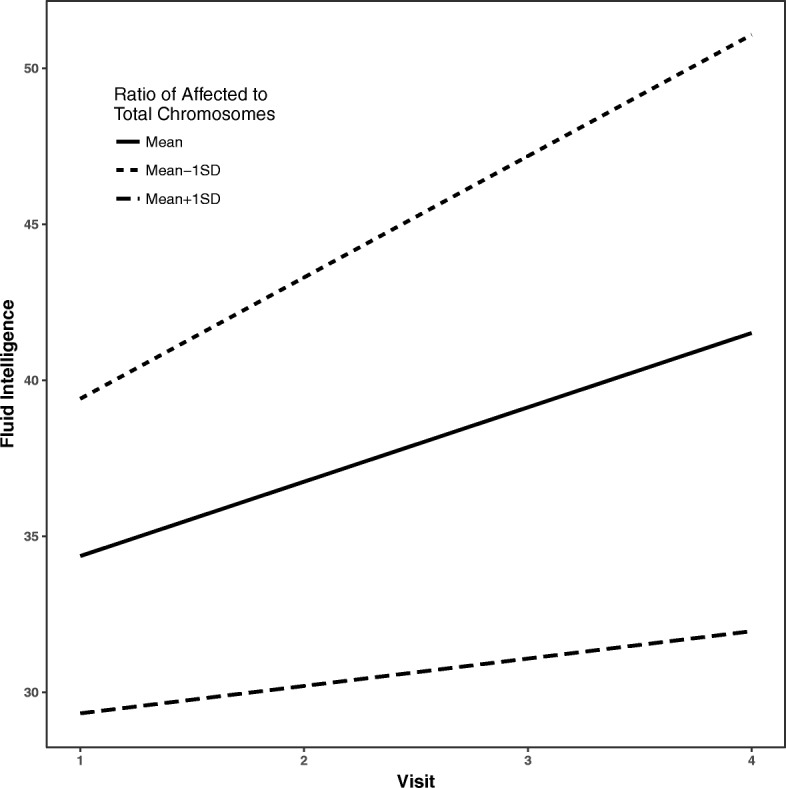
Fig. 1.

Gains over time in fluid reasoning predicted by X-activation ratio. Legend: estimated average trajectories over time in fluid intelligence for individuals with X-activation ratio at the mean (solid), 1 standard deviation (SD) below the mean (short-dashed) and 1 SD above the mean (long-dashed). Higher ratios of affected to total chromosomes were associated with a slower rate of improvement in fluid intelligence over time
