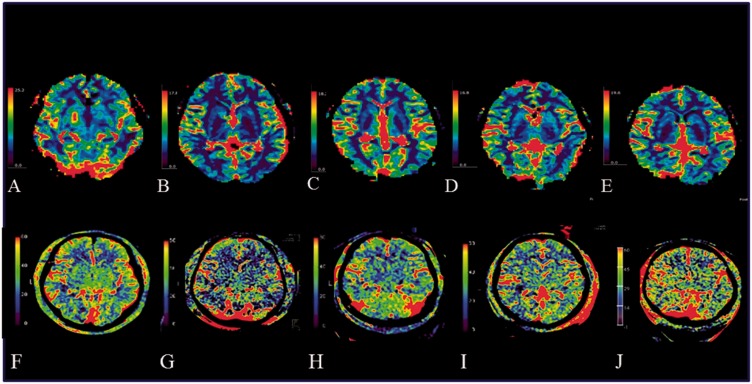
Figure 2.
Comparison of FD-PBV and MR-CBV images of five patients. (A–E) MR-CBV (top row). (F–J) FD-PBV (bottom row). (A, F) Patient 1, 28% CM. (B&G) Patient 4, 24% CM. (C, H) Patient 5, 20% CM. (D, I) Patient 7, 16% CM. (E, J) Patient 9, 12% CM. In other publications using the intravenous approach, the anatomical structures of the basal ganglia could be recognized. In our images, only in (F) (dilution 28%) could the structures of the basal ganglia can be recognized. In images (G–J), only image noise seems to be visible. Abbreviations: CBV, cerebral blood volume; FD, flat-panel detector; MR, magnetic resonance; PBV, parenchymal blood volume

