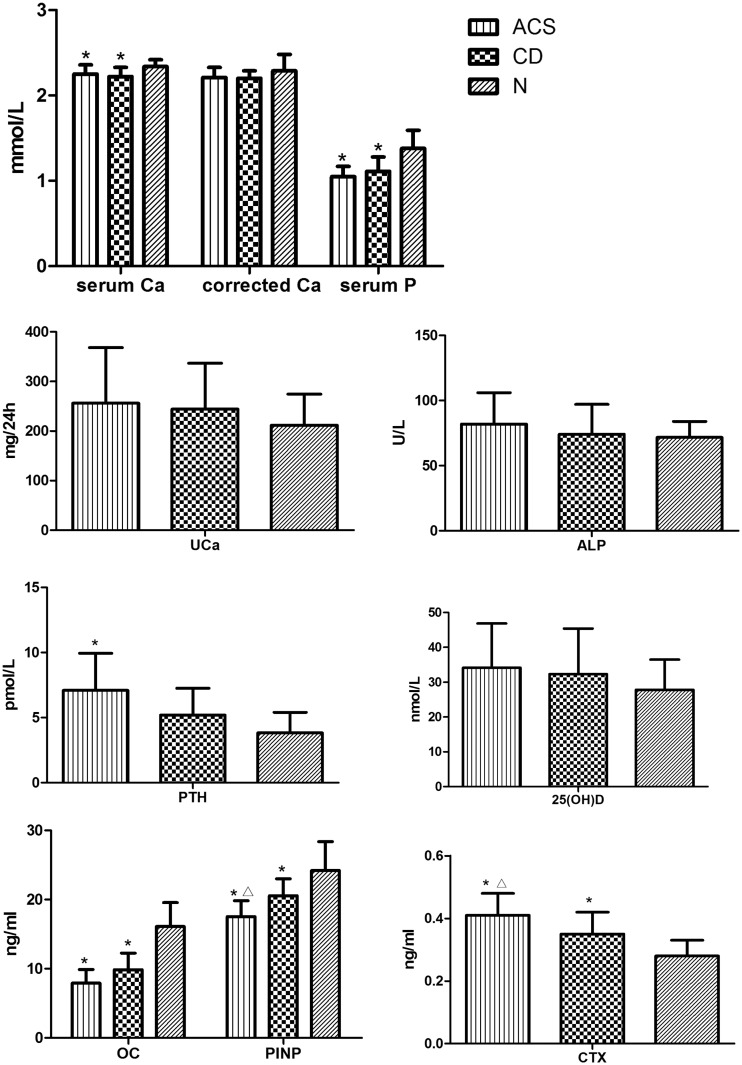
Figure 3.
Comparison of bone turnover markers between the adrenal-dependent Cushing’s syndrome (ACS), Cushing’s disease (CD), and healthy control (N) groups
Values are expressed as mean ± standard deviation.
*P < 0.05 compared with the N group; ΔP < 0.05 compared with the CD group
Ca, calcium; P, phosphorus; UCa, urinary calcium; ALP, alkaline phosphatase; PTH, parathyroid hormone; OC, osteocalcin; PINP, procollagen type I N-terminal propeptide; CTX, collagen type I cross-linked C-telopeptide

