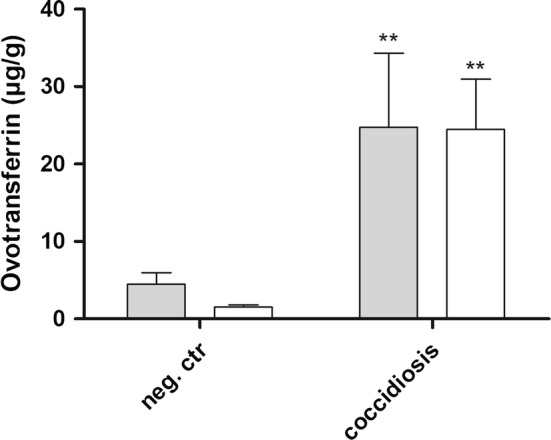
Figure 2.

Ovotransferrin concentrations in faecal and litter samples from experimental Eimeria-infected and control birds. The graph represents the ovotransferrin concentration measured by ELISA (mean ± standard error of the means) in faeces (grey) or mixed litter (white) from experimental Eimeria-infected birds (coccidiosis; individual faeces samples: n = 10 or mixed litter samples: n = 6) or non-challenged control birds (neg. ctr; individual faeces: n = 10 or mixed litter samples: n = 5). Significant differences between the coccidiosis group and the non-challenged control group are indicated with **p < 0.01.
