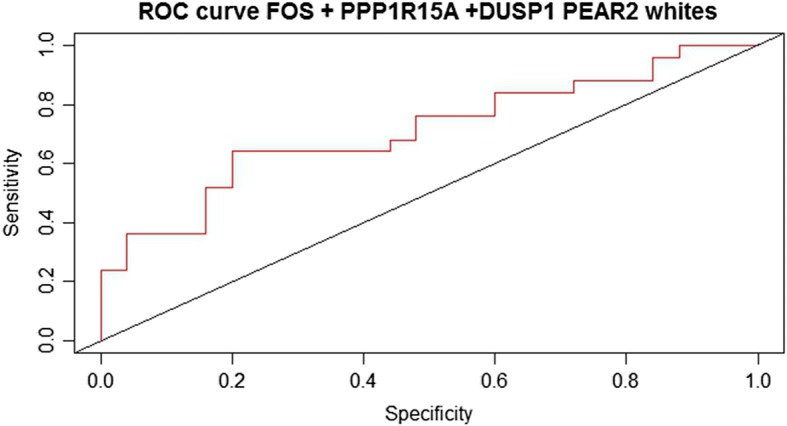
Fig. 1.

Receiver operator curve for assessment of logistic regression model prediction in PEAR-2. Statistical model including thiazide diuretic (TD) genes FOS, DUSP1 and PPP1R15A showed area under the curve was 0.71, indicative of the model’s good prediction for blood pressure response to TD. Gene expression measures reported in Fragments per Kilobase of Exon per Million mapped (FPKM)
