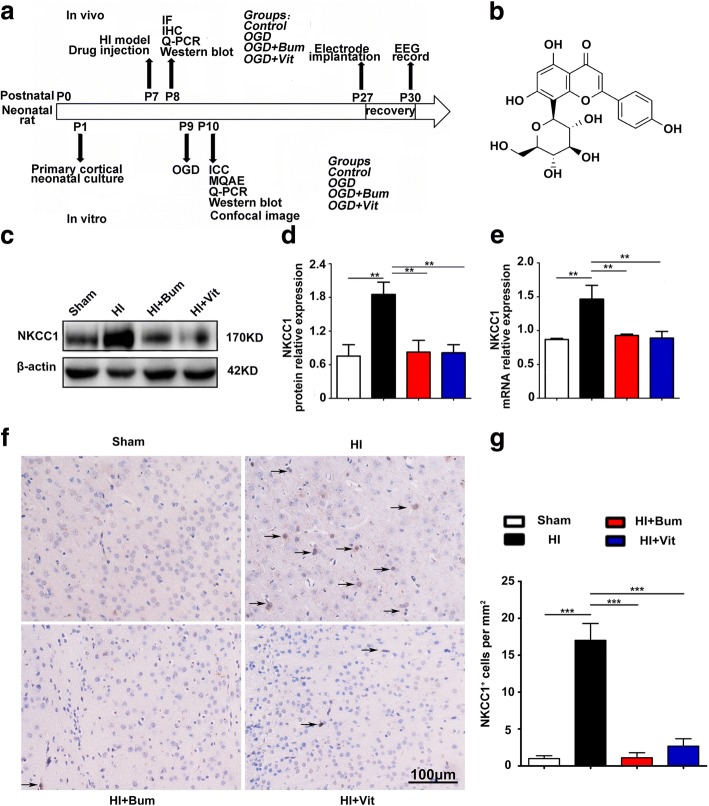
Fig. 1.
Structure and effect of vitexin on HI-induced NKCC1 expression in hypoxia-ischemia brain tissue. a Diagram of the experimental design. b The structure of vitexin. c, d Representative protein expression levels of NKCC1 (170 kDa) and β-actin (42 kDa) in the cerebral tissue of the sham, HI, HI+Bum, and HI+Vit groups were evaluated. e The graphical representation of the fold changes in NKCC1 mRNA expression in each group as quantified by normalization to β-actin as an internal control. Data are shown as the mean ± SEM; **P < 0.01 compared to the HI group, n = 4 per group, based on a one-way ANOVA. f Cortical penumbral regions of coronal sections from the rats of each group were subjected to immunohistochemistry using an anti-NKCC1 antibody, and stereological counts of NKCC1+ cells (arrows) in each group are shown. Scale bar = 100 μm. g The graph shows the mean number of NKCC1+ cells per square millimeter. Data are expressed as the mean ± SEM; one-way ANOVA, ***P < 0.005 in comparison with the HI group, n = 4 per group

