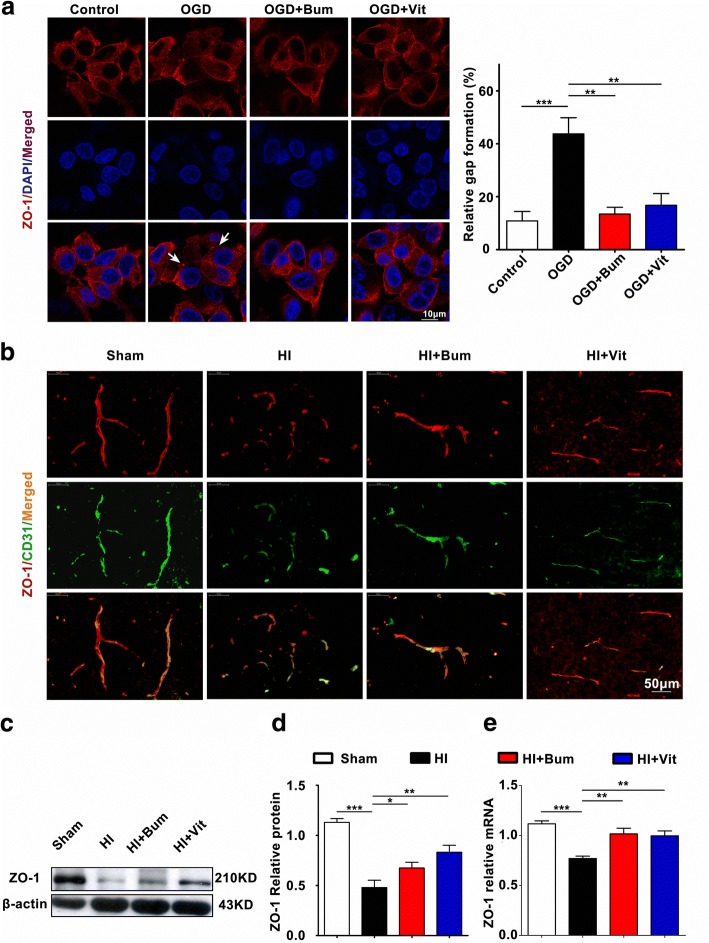
Fig. 4.
Vitexin inhibited HI-induced BBB destruction assayed by tight junction-related ZO-1. a TJs are characteristically located at cell–cell contact sites and are intact under physiological conditions. Confocal image of ZO-1 demonstrated disruption of the tight junctions and gap formation following OGD in RBMECs. Arrows indicate tight junction disruption. Scale bar = 50 μm. b Immunofluorescence staining for ZO-1 (red) and CD31 (green), a capillary endothelia marker, in the ischemic cortex of the sham, HI, HI+Bum, and HI+Vit groups 24 h after HI. Merged images of ZO-1 and CD31 staining are also shown. Scale bar = 50 μm. c, d Representative western blot for ZO-1 protein levels in the cerebral cortex from rats of each group. Densitometric value of the protein bands normalized to the respective β-actin is also shown. *P < 0.05, **P < 0.01, ***P < 0.001. e The mRNA expression of ZO-1 in the ipsi-ischemic brain tissue of each group was analyzed by real-time quantitative PCR. Data are shown as the mean ± SEM; **P < 0.01, ***P < 0.001 in comparison with the HI group, n = 4~6 per group, based on a one-way ANOVA

