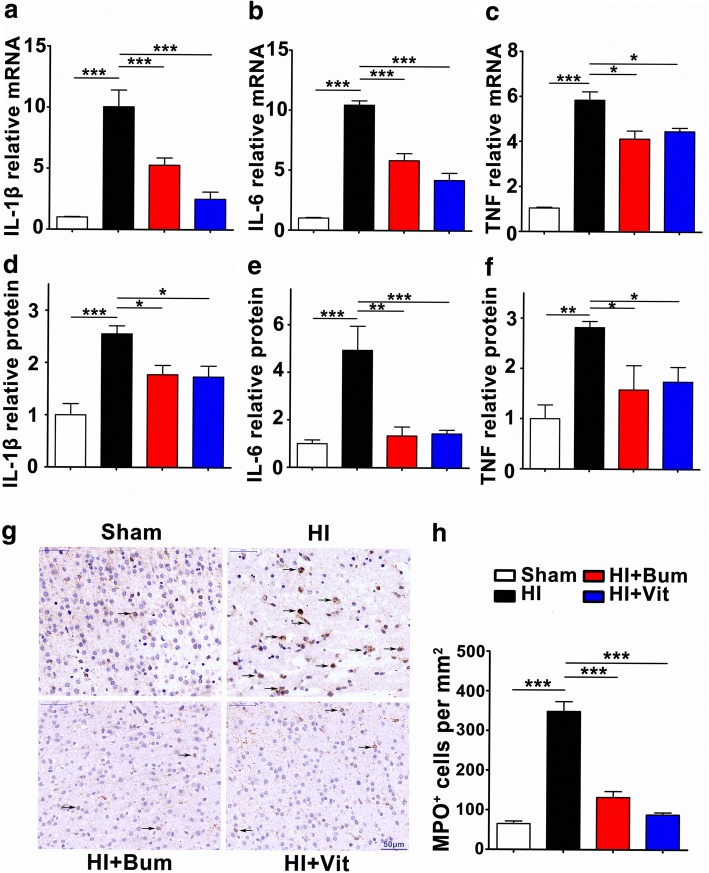
Fig. 5.
Vitexin alleviated HI-induced neutrophil infiltration and inflammatory cytokine expression. Panels a, b, and c show the graphical representation of the fold changes in IL-1β, IL-6, and TNF mRNA, respectively. Relative protein levels of IL-1β (d), IL-6 (e), and TNF (f) in brain tissue samples were measured with ELISA. Data were normalized against the protein level of the sham group, from six separate experiments. g Cortical penumbral regions of coronal sections from the rats of each group were subjected to immunohistochemistry using an anti-MPO antibody, and stereological counts of MPO+ cells (arrows) in each group are shown. Scale bar = 50 μm. h The graph shows the mean number of MPO+ cells per square millimeter. Data are expressed as the mean ± SEM; one-way ANOVA, *P < 0.05, **P < 0.01, ***P < 0.001 in comparison with the HI group, n = 5 per group

