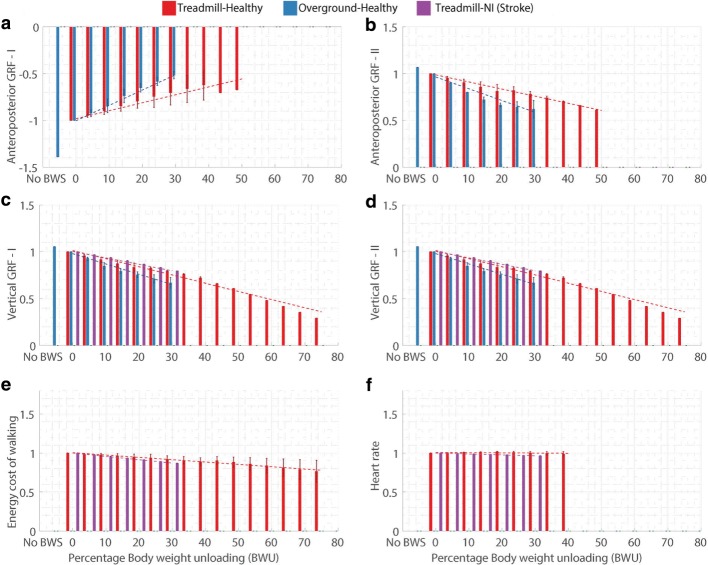
Fig. 5.
Influence of body weight unloading on ground reaction forces (GRF) and metabolic parameters where a. Anteroposterior GRF negative (deceleration) peak, b. Anteroposterior GRF positive (acceleration) peak, c. Vertical GRF peak I, d. Vertical GRF peak II, e. Energy cost of walking, and f. Heart rate. Vertical bars represent the normalized mean values, error bars depict standard deviation between studies and dashed lines illustrate the result of linear regression for each category. Absence of error bar at a BWU level indicates that the data was available from only one study

