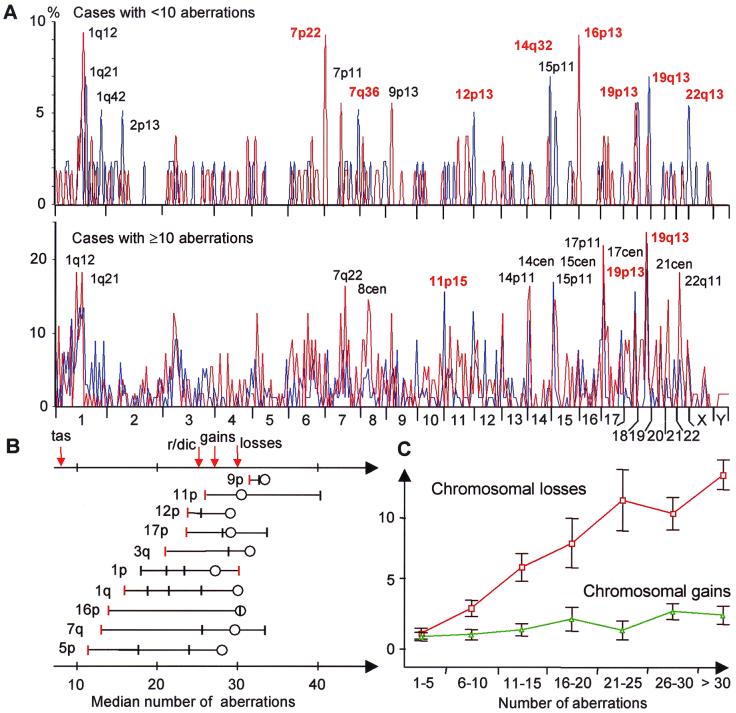
Figure 1.
(A) Chromosome breakpoint profiles of 102 PC (blue line) and 140 OS (red line). Cases with <10 aberrations preferentially showed breakpoints in telomeric bands (red type), whereas cases with ≥10 aberrations preferentially had breakpoints in interstitial bands (black type); only the 15 most frequent breakpoints have been indicated. (B) Evolution of breakpoints along chromosomes in OS. For each chromosome arm, the median of the total number of aberrations per case has been indicated for tumors with terminal breakpoints (red bars), interstitial breakpoints (black bars), and chromosome arm losses (circles). In all arms, except 1p, terminal breaks occurred at lower levels of cytogenetic complexity than interstitial breaks. Telomeric associations (tas) occurred in tumors with few aberrations, followed by rings (r) and dicentrics (dic), gains, and finally losses of chromosome arms. (C) The mean number of whole chromosome losses (red) increased in parallel to the total cytogenetic complexity in OS, whereas the number of whole chromosome gains (green) remained constant; vertical bars represent confidence intervals.

