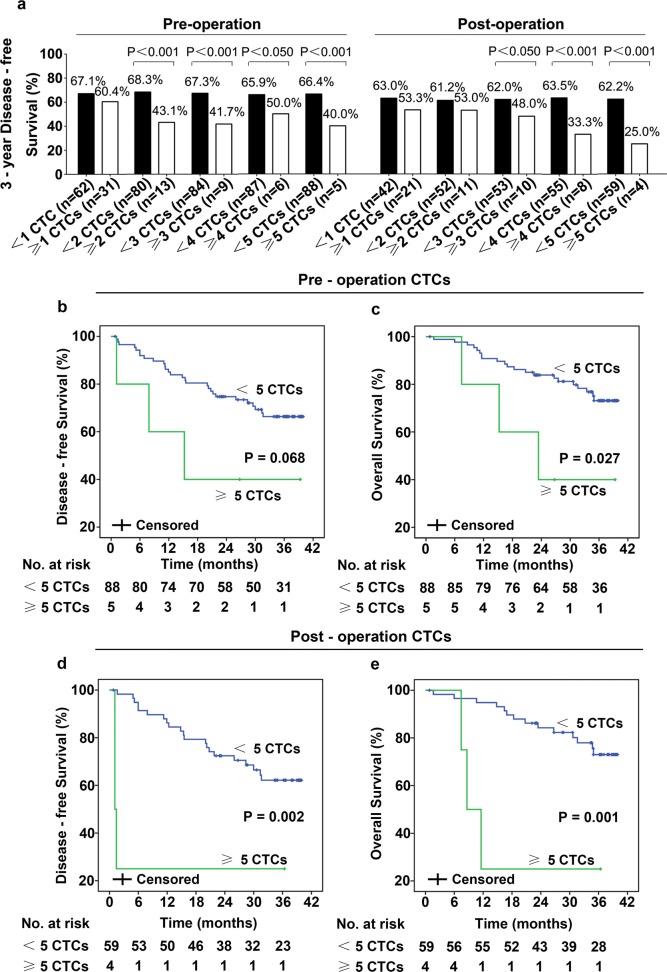
Fig. 3.
3-year DFS was lower in patients who had more CTCs (a), the filled black columns represent the 3-year DFS of patients who had CTCs no more than the cut-off value, and the empty white columns represent 3-year DFS of patients who had CTC more than the cutoff value. Patients who have ≥ 5 CTCs/7.5 ml blood pre-operatively had shorter DFS (b, d) and OS (c, e)

