Figure 4.
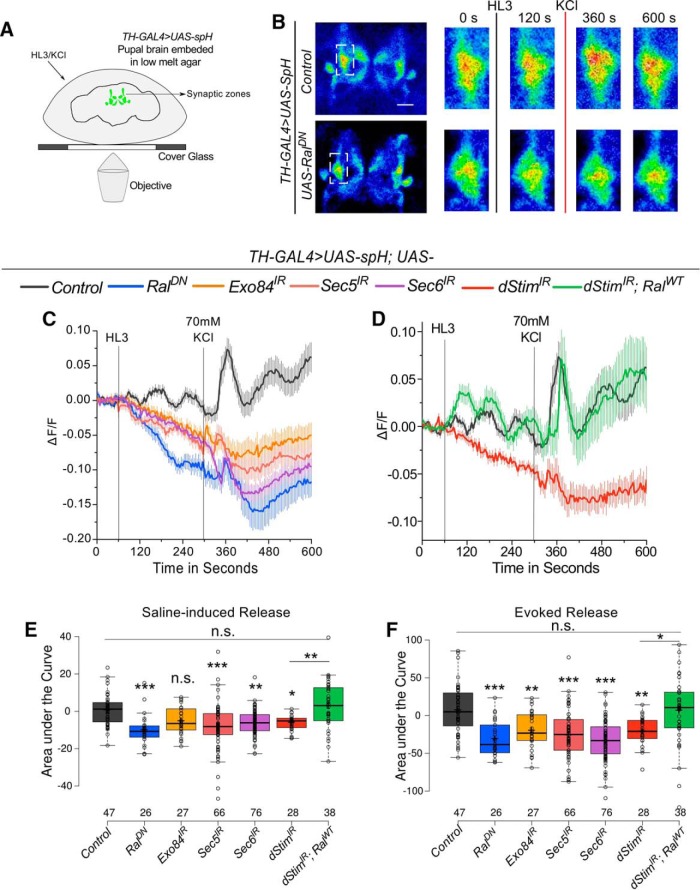
dStim regulates evoked synaptic release from pupal dopaminergic neurons through Ral (Refer to Fig. 4-1 and Table 1-1). A, Schematic representation of the experimental setup used to image vesicular release from pupal brains. B, Representative images of central regions of pupal brains expressing spH in dopaminergic neurons. Boxed images on the right were obtained by zooming into the inset (white box in the images on the left) at the indicated time points of the time series. C, D, Traces represent average (±SEM) change in fluorescence of spH over time from brains of the indicated genotypes. Points of addition of HL3 and KCl are denoted by vertical lines. E, F, Amount of release quantified as area under the curve from 60 to 300 s (E-Saline–induced) and 300 to 600 s (F-KCl–evoked) from traces in C and D is represented as box plots for the indicated genotypes. Box plot symbols are as described in Fig. 1. Numbers below the boxes represent number of ROIs in which fluorescence changes were measured. They were obtained from a minimum of five brains per genotype. *, p < 0.05, **, p < 0.01, ***, p < 0.001, n.s., not significant at p < 0.05 by one-way ANOVA followed by post hoc Tukey’s test. All comparisons for significance were with the control values except where marked by a horizontal line. For exact p-values, refer to Table 1-1.

