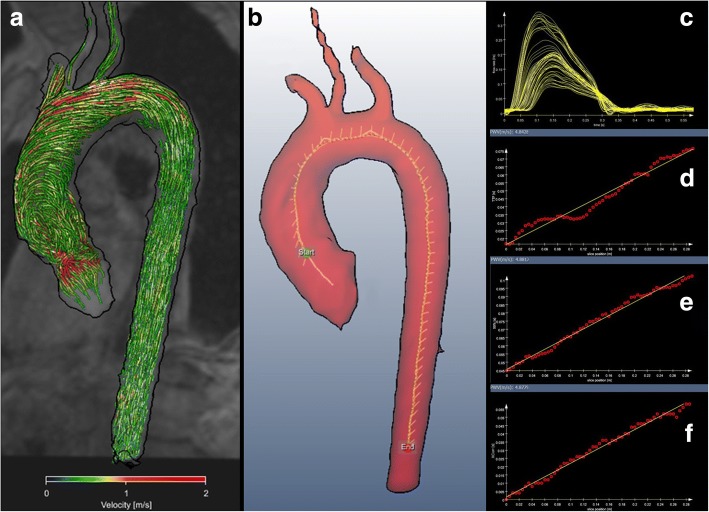
Fig. 1.
Calculation of pulse wave velocity. 4D flow MRI represents 3D and time-resolved absolute blood flow velocities in the thoracic aorta. In this example, blood flow is visualized using color-coded streamlines (a). After vessel segmentation, a centerline and multiple analysis planes (white lines) are automatically positioned perpendicular along the aorta with an inter-plane distance of 5 mm from the starting point (green) to the end point (red) (b). Based on time-resolved blood flow velocities PWV is automatically calculated (c). Software provides values in m/s based on the time-to-foot (d) 50%-rule (e) or cross correlation (f) method using a linear slope fitted to all single values. PWV in this young subject was 4.84 m/s, 4.88 m/s and 4.88 m/s, respectively

