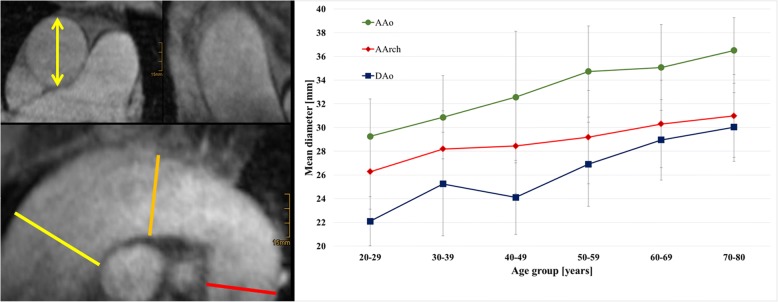
Fig. 3.
Correlation of aortic diameter with age. Left: Maximum aortic diameter was measured based on 3D bright blood T1 weighted CMR using axial slides (yellow arrow) orientated normal to the aorta at the level of the ascending (yellow bar) and descending aorta (red bar) at the level of the pulmonary artery and at the summit of the arch (orange bar) between the vessel outlets. Right: Increase of mean diameter of the ascending, arch, and descending aortic diameter with age is shown. Diameters of the ascending aorta and of the aortic arch were not different between adjacent age groups

