Fig. 5.

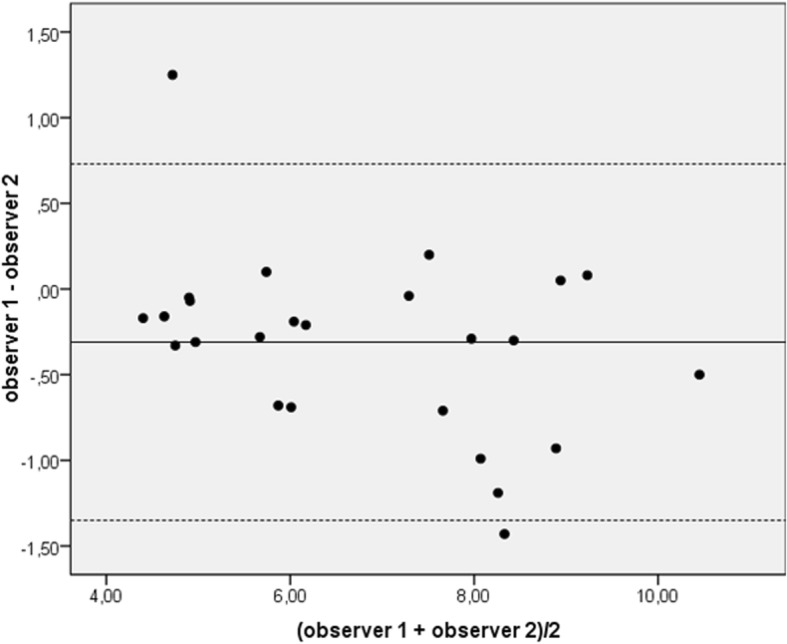
Bland-Altman plot of the inter-observer agreement of PWV in m/s. PWV was calculated based on 4D flow CMR data of 25 subjects of the study cohort. Mean difference (solid line) ± 1.96 x standard deviation (dashed lines) is shown

Bland-Altman plot of the inter-observer agreement of PWV in m/s. PWV was calculated based on 4D flow CMR data of 25 subjects of the study cohort. Mean difference (solid line) ± 1.96 x standard deviation (dashed lines) is shown