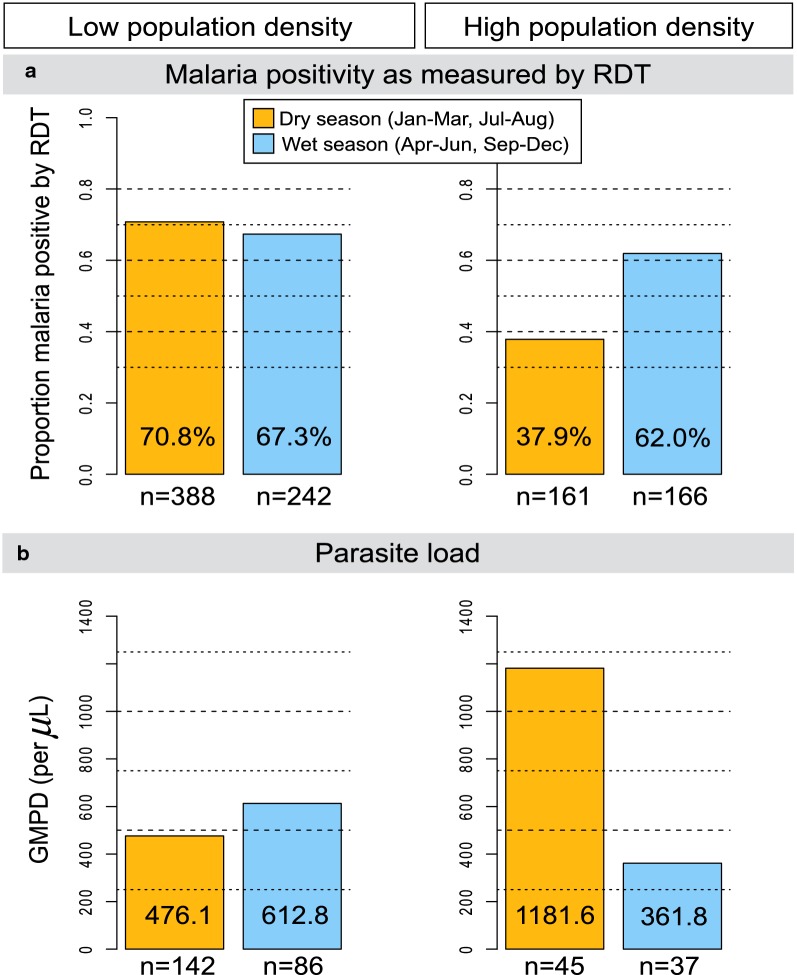
Fig. 3.
Bar graphs showing weighted malaria weighted per cent Plasmodium falciparum parasite prevalence, based on the RDT, by season (wet or dry) in low- and high-population density villages (a) and the GMPD/µL among microscopy-positive children by visit season in low- and high-population density villages (b) among apparently healthy children enrolled in 12 random between November 2011 and February 2014 in north-central and northwest Uganda. Note: Orange shading is used for dry season months, while blue shading is used for wet season months. Wet and dry seasons are based on categorization by the Uganda Bureau of Statistics and generally correspond to ≥ 10 days/month for wet months and < 10 days/month for dry months. The unweighted number of participants in each group is shown

