
Fig. 1.
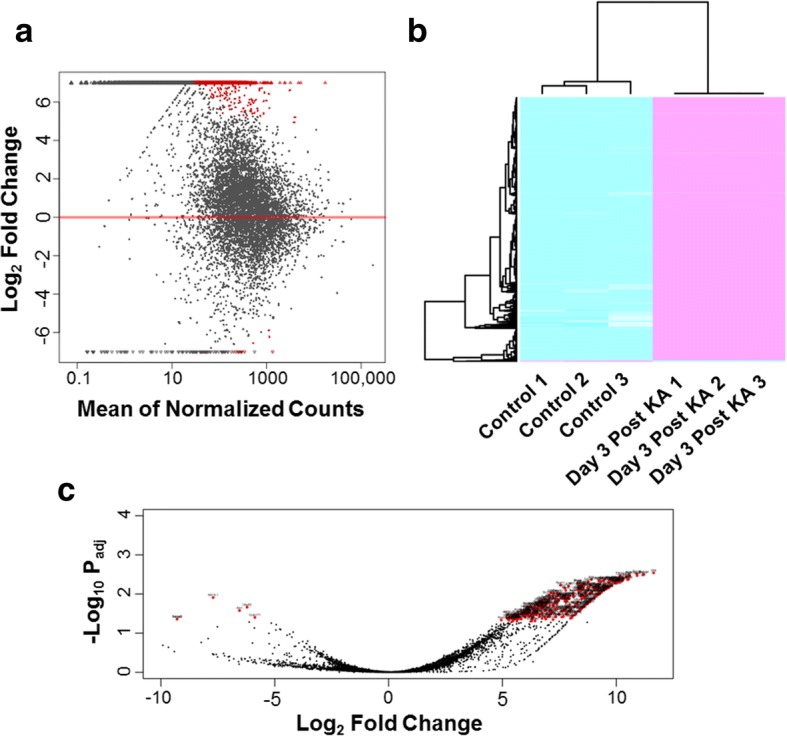
Differentially expressed genes between the sham control and KA treated groups. a MA-plot of gene expression. All significant differentially expressed genes (Padj < 0.05) and locally weighted smoothing (LOESS) line are colored in red. b Heat map and hierarchical clustering was performed based on all differentially expressed genes. Magenta indicates high relative expression, and cyan indicates low relative expression. c Volcano plot of gene expression. All significant differentially expressed genes are colored in red and labeled by gene symbols