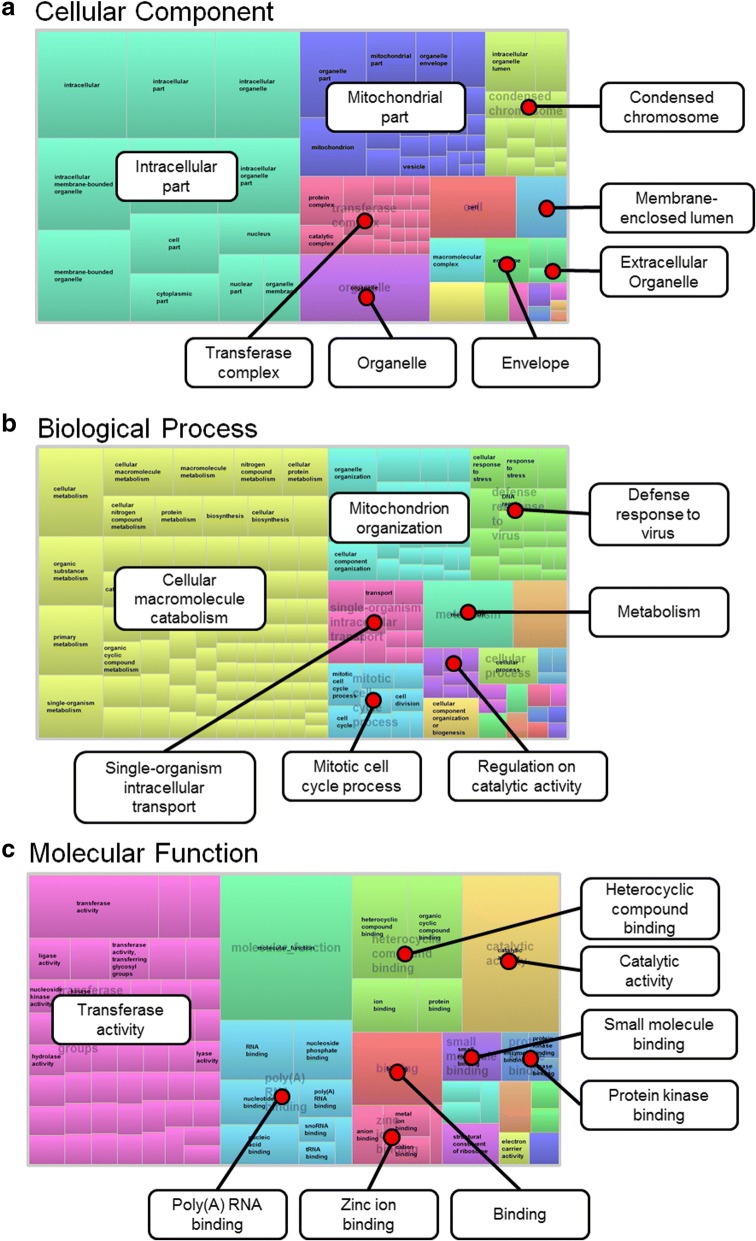
Fig. 3.
Functional classification of the differentially expressed genes. a Cellular component. b Biological process. c Molecular function. Visualization of identified Gene Ontology terms was completed using REViGO [22]. Analysis was run using the Padj for each identified term, medium allowed similarity (0.7), and SimRel similarity measurement. Individual term size weight within each TreeMap was determined by associated Padj.

