Abstract
Introduction:
Forced diuresis technique is often adopted to wash out the high amount of urinary radioactivity that masks the foci of abnormal uptake in the pelvic region on 68Ga-PSMA-HBED-CC positron emission tomography/computed tomography (PET/CT) scan in prostate cancer (PC) patients. However, this method is time-consuming, makes the patient non/less compliant, and is not feasible in patients with renal dysfunction. We hypothesized that early dynamic imaging can obviate the need for a postdiuresis view as the urinary activity is expected to be low at the time.
Materials and Methods:
A total of 20 biopsy-proven PC patients who were referred to our department for a 68Ga-PSMA PET/CT for staging/restaging were prospectively studied. Dynamic PET/CT was done with on table intravenous (i.v.) injection of 2–3 mCi (74–111 MBq) of the radiotracer. Dynamic images were acquired over the pelvis with a frame time of 1 min for 10 min. Static images of 2 min/bed position were acquired between 45 and 60 min p.i. The patients were then administered i.v. furosemide and encouraged water intake and frequent urination. A static view of pelvic region was acquired at 5 min/bed at 120 min p.i. A three-dimensional volume of interest (3D-VOI) was plotted on the primary lesion, bladder, involved nodes if any, pelvic bones at involved and uninvolved sites, gluteal muscles, and artery. The sentence seems fine. This was to generate the Time activity curve for analysis.
Results:
Nine patients were referred for staging and 11 for restaging. Mean age of 20 patients was 64.6 years, and median prostate-specific antigen level was 21.4 ng/ml (range: 0.05–2180). Prostatic lesion was present in 20 patients, nodal involvement in 8, and bone involvement in 10 patients. Median maximum standardized uptake value (SUVmax) of the prostatic lesion (P) showed an ascending trend: 5.31 at 5 min, 10.65 at 60 min, and 10.52 at 120 min p.i. At the same time, median SUVmax of the bladder (B) also progressed steeply and then decreased postdiuresis: 1.01 at 5 min, 24.6 at 60 min, and 6.88 at 120 min. Despite forced diuresis, the bladder activity remained higher than that during early dynamic imaging. Median prostate-to-bladder (P/B) ratio was highest during early dynamic imaging at 5 min p.i. was 5.17, while at 60 min, P/B ratio was 0.42 (P = 0.002) and, at 120 min, it was 1.27 (P = 0.009). Further, all the nodal and bone lesions were clearly visualized on early dynamic images.
Conclusion:
The study results suggest that early dynamic imaging performs better than a postdiuresis view in terms of delineation of prostatic and regional lesions on 68Ga-PSMA scan. Further, it saves time and the patients are more compliant to this technique.
Keywords: 68Ga-PSMA, adenocarcinoma prostate, early dynamic positron emission tomography/computed tomography, postdiuresis image
Introduction
68Ga-PSMA-HBED-CC is now frequently used for the evaluation of prostate cancer (PC) patients. It targets the cell surface protein prostate-specific membrane antigen (PSMA) and overexpressed in PC cells and few other normal PSMA-expressing tissues such as the kidney, proximal small intestine, and salivary glands.[1,2,3,4] Although the diagnosis of PC currently depends on histopathologic verification of adenocarcinoma obtained by sector biopsy, 68Ga-PSMA positron emission tomography/computed tomography (PET/CT) plays an important role in staging, restaging, response assessment, and detection of local recurrence.[5,6,7,8] The physiologic uptake of the tracer is seen in lacrimal glands, parotid glands, submandibular glands, liver, spleen, small intestine, and colon. Apart from these, the tracer has a renal route of excretion due to which high radiotracer uptake is seen in kidneys and urinary collecting system including urinary bladder.
Due to the proximity of urinary bladder and prostate, the high radioactivity in urinary bladder often masks the prostatic lesions, especially the smaller ones, and surrounding regional nodes and metastatic sites. To overcome this, diuretics are administered intravenously and a delayed scan is acquired. However, this approach is difficult to implement in a busy department and also reduces patient compliance due to long waiting duration.[9]
Recently, few studies reporting early tracer uptake in the prostatic lesion, much before the urinary bladder, have suggested that early images might facilitate better visualization of prostate and other regions of interest (ROIs) in the pelvic region that otherwise are difficult to identify in the presence of a high radioactivity in the urinary bladder. Based on this, we performed a preliminary study to evaluate the role of early dynamic imaging in 68Ga-PSMA PET/CT and observed a better target to nontarget contrast in early images than the usual 60-min static image.[10] Since diuretic administration is now increasingly used in 68Ga-PSMA PET/CT scan to enhance tracer washout from the urinary bladder for better delineation of lesions, it is imperative to compare the efficacy of early images with postdiuresis images in detection of prostate lesions or local metastatic lesions in the pelvic region. Following the encouraging results of our previous study,[10] we conducted the present prospective study to compare the early dynamic imaging in 68Ga-PSMA-11 PET/CT with postdiuresis image for detection of PC lesions (primary/recurrent). The results of dynamic images were compared visually as well as quantitatively with static images acquired at 60 min p.i. as well as postdiuresis view at 120 min p.i.
Purpose of the present study was to evaluate whether the early imaging can replace the postdiuresis images altogether, in routine clinical practice. This, in turn, can considerably reduce patient waiting time, thereby increasing patient compliance. The effect on image quality has also been assessed.
Materials and Methods
Twenty patients with biopsy-proven adenocarcinoma prostate and rising prostate-specific antigen (PSA) levels referred for 68GA-PSMA-HBED-CC PET/CT for staging/restaging were included in the study. Patients with dual malignancy, renal impairment (serum creatinine >1.2 mg%), and/or hepatic impairment (total bilirubin >1.3 mg%, elevated serum glutamic-oxaloacetic transaminase/serum glutamic-pyruvic transaminase/alkaline phosphatase) were excluded from the study. All the patients underwent 68GA-PSMA-HBED-CC dynamic PET/CT followed by delayed whole-body PET/CT on Biograph mCT PET/CT with lutetium oxyorthosilicate crystal and 64-slice CT scanner (Siemens Inc., Germany). The patients were then administered intravenous (i.v.) diuretic, and postdiuresis view was acquired over pelvic region.
Image acquisition
First, a low-dose noncontrast CT was acquired over the pelvic region at 50–100 mAs followed by on-table tracer injection (2–3 mCi [74–111 MBq]). Dynamic images were acquired in one-bed position, at 1 min/frame for 10 min. At 45–60 min p.i., whole-body PET/CT images of 2–3 min/bed position from vertex to midthigh were acquired. The patients were then administered i.v. furosemide (20–40 mg) and encouraged water intake and frequent urination. A static view of the pelvic region was acquired at 5 min/bed at 120 min p.i. No i.v. or oral contrast was used. Images were reconstructed with iterative reconstruction using OSEM algorithm with 3 iterations and 21 subsets.
Image analysis
Dynamic and static images were interpreted by two nuclear medicine physicians, independently. Volume of interest/ROI was drawn on the primary lesion (P), urinary bladder (UB), normal bone (B), muscle (M), artery (A) and involved bone lesion (BI), and node (N), if present. ROIs drawn on one frame were copied to the other frames. Time-activity curves (TAC) were generated. Semi-quantitative and quantitative analysis was done.
Primary lesions were correlated with histopathology findings. For nodal lesions, findings were correlated with available magnetic resonance imaging and PSA levels, and nodes showing increased PSMA expression in the draining areas of the prostate, with loss of architecture on CT, were considered metastatic. For bony lesions, CT features of dense sclerosis with increased PSMA expression on PET, in the setting of commensurately increased PSA levels, were considered metastatic. Bone scan was used for corroboration where available.
Statistical analysis
Descriptive statistics were applied to all parameters to estimate mean, median, range, and standard deviation. Maximum standardized uptake value (SUVmax) of P was compared with that of UB, B, M, A, BI, and N. To test the significance of difference of SUVs between primary lesion and other areas, Wilcoxon signed-rank test was applied. P < 0.05 was considered significant.
Results
Mean age of the patients was 64.6 years (range: 60–76 years). Median PSA level was 21.4 ng/ml (range: 0.05–2180) and mean Gleason score was 8. Of the 20 patients, 9 were referred for staging and 11 for restaging. All the patients showed pathologic tracer uptake in the primary prostatic lesion, while nodal and bone involvement was seen in 12 and 8 patients, respectively, on dynamic images.
Tracer uptake was observed in the primary prostatic lesion (P) as early as 1 min p.i. in all patients that followed a temporally increasing trend reaching its zenith during the dynamic study in the past 3 min. On the other hand, the radioactivity in UB was visually insignificant until 4 min p.i. and reached maximum during last frame, that is, at 10 min p.i. The radioactivity in P at static image (60 min p.i.) was even higher than that during dynamic images, but at the same time, UB activity was also higher [Table 1]. Postdiuresis (120 min p.i.), the prostate radioactivity was almost the same as 60 min with an insignificant difference (P = 0.49). As expected, the radioactivity in UB decreased significantly postdiuresis (P = 0.004); however, the radioactivity level did not drop as low as that during dynamic study [Figure 1]. Difference between the SUVmax of P and UB (P > UB) was significant throughout the dynamic study at all time points (P < 0.05). However, the difference between SUVmax of P and UB on postdiuresis image (P > UB) was insignificant (P = 0.12). At 60 min p.i., static image P < UB (P = 0.26).
Table 1.
Median maximum standardized uptake value of various regions at different time points
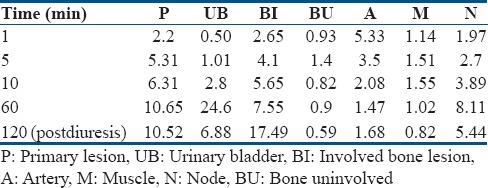
Figure 1.
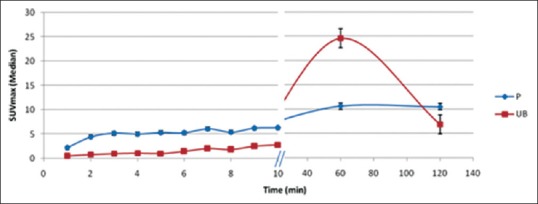
Time-activity curve of primary and urinary bladder during dynamic imaging
Median SUVmax of all the studied regions (P, UB, B, M, A, BI, and N) at all time points during the dynamic scan, 60 min static, and 120 min postdiuresis scan time is given in Table 1. The activity in B and M remained low in all the patients throughout the dynamic scan. The arterial activity was highest at initial 1–2 min p.i. and then decreased temporally as the radioactivity is cleared from the blood following normal tracer kinetics [Figure 2].
Figure 2.
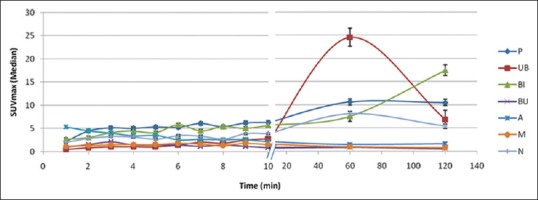
Time-activity curve of various regions at different time points
The activity in the involved node also remained less than that of the primary lesion at all time points. Involved bone lesions showed variable activity depending on the nature and extent of metastasis [Figure 2]. All the nodes and bone lesions in the pelvic region detected on 60 min static and 120 min postdiuresis images could also be seen on early dynamic images.
Median P/UB ratio at different time points during dynamic scan and delayed scan is given in Table 2. P/UB ratio was highest at 5 min p.i. followed by a gradual decrease and reached minimum at 60 min p.i. and then increased slightly at 120 min p.i. P/UB was significantly higher at 5 min p.i. (dynamic phase) than that at 60 min (P = 0.002) as well as at 120 min (P = 0.009). Furthermore, P/UB at 120 min p.i. was significantly higher than that at 60 min (P = 0.01) [Figure 3].
Table 2.
Prostate-to-urinary bladder ratio at different time points
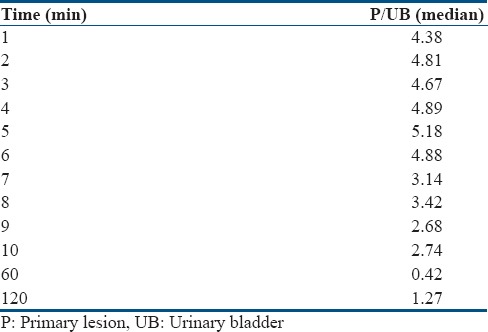
Figure 3.
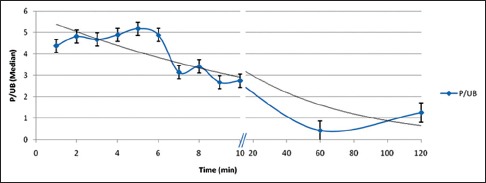
Prostate-to-urinary bladder uptake ratio at different time points
Discussion
TACs generated show that the tracer uptake occurred in the prostatic lesion as early as 1 min p.i. The uptake then increased temporally thereafter displaying an ascending trend [Figure 1]. The activity in prostatic lesion was highest at static image 60 min p.i. and then remained constant. Difference between the tracer uptake in the prostatic lesion at static image (60 min p.i.) and postdiuresis image (120 min p.i.) was insignificant (P = 0.49). The activity in the urinary bladder was negligible till 4 min p.i. and then increased gradually till static image (60 min p.i.). The diuretic administration enhanced the radiotracer washout and thus the activity decreased at 120 min p.i.
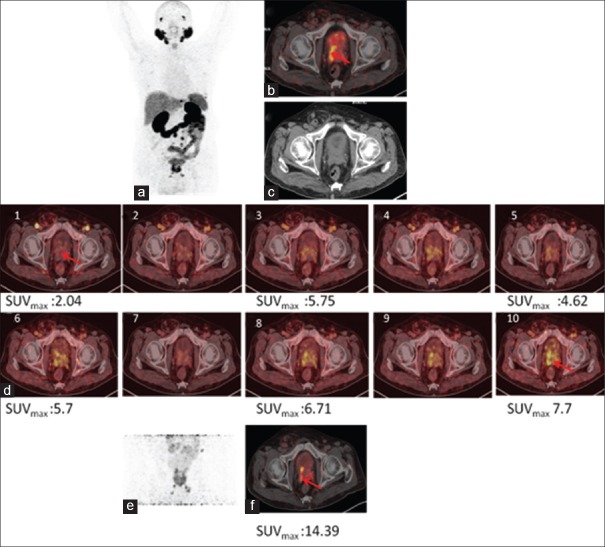
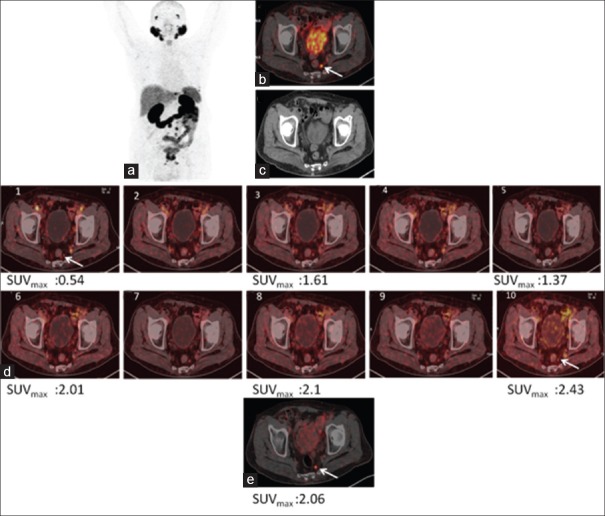
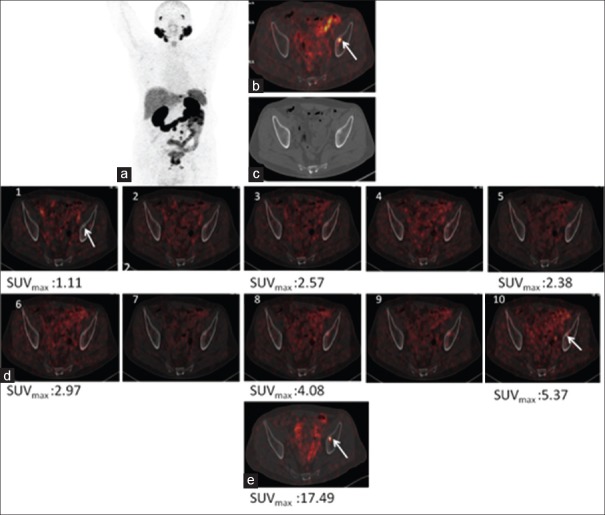
In accordance with the hypothesis, the difference between tracer uptake in prostatic lesion and urinary bladder was significant (higher in prostatic lesion; P < 0.05) on dynamic images, but it was insignificant on static as well as postdiuretic image (P = 0.26 and 0.12). Although, administration of diuretic increased P/UB ratio at 120 min p.i. but not as much as early image at 5 min p.i. (P = 0.001). Administration of diuretic increased P/UB ratio at 120 min p.i., but result was better in early image at 5 min p.i. (P = 0.001). As observed by the reporting nuclear medicine physician, the target to nontarget contrast was observed to be better on early images as compared to 60 min static and postdiuresis image [Figures 4-6].
Figure 4.
68Ga-PSMA-11 positron emission tomography/computed tomography in a prostate cancer patient with biochemical recurrence. Maximum intensity projection (a), fused positron emission tomography/computed tomography (b), and computed tomography (c) of whole-body positron emission tomography 60 min p.i. showing uptake in pathologic lesion. (d) Dynamic images showing progressively increasing uptake in prostatic lesions whereas urinary bladder activity remains insignificant. (e) Showing prostatic lesion maximum intensity projection and axial section (f) on postdiuresis image
Figure 6.
68Ga-PSMA-11 positron emission tomography/computed tomography in a prostate cancer patient with biochemical recurrence. Maximum intensity projection (a), fused positron emission tomography/computed tomography (b), and computed tomography (c) of whole-body positron emission tomography 60 min p.i. showing uptake in metastatic node. (d) Dynamic images showing progressively increasing uptake in prostatic lesions whereas urinary bladder activity remains insignificant. (e) Showing prostatic lesion in post diuresis image
Figure 5.
68Ga-PSMA-11 positron emission tomography/computed tomography in a prostate cancer patient with biochemical recurrence. Maximum intensity projection (a), fused positron emission tomography/computed tomography (b), and computed tomography (c) of whole-body positron emission tomography 60 min p.i. showing uptake in involved bone lesion. (d) Dynamic images showing progressively increasing uptake in prostatic lesions whereas urinary bladder activity remains insignificant. (e) Showing prostatic lesion in postdiuresis image
Metastatic bone lesions in the pelvis were observed in 8 patients. Tracer uptake could be seen in these lesions in the initial 1–2 min p.i. and then kept increasing with time. The maximum activity was seen at postdiuresis image 120 min p.i. Radioactivity in bone lesion was significantly higher than that in urinary bladder at all time points during dynamic images (P < 0.05). Lesion uptake was higher than urinary bladder activity in postdiuresis images (120 min p.i.) as well, but the difference was insignificant (P = 0.49). However, in the static images (60 min p.i.), the urinary bladder activity was higher than the bone lesions, but the difference was insignificant (P = 0.06).
Twelve patients were observed to have regional nodal metastasis in the pelvis. The nodal activity could be visualized at 1 min p.i. It reached its peak in the static image 60 min p.i. and then decreased at 120 min p.i. The nodal activity was significantly higher than urinary bladder activity during dynamic images (P < 0.05). However, in static image (60 min p.i.), as well as postdiuresis image (120 min p.i.), the urinary bladder radioactivity was higher than that in metastatic nodes, with an insignificant difference (P = 0.16 and 0.38).
The arterial radioactivity was high initially at 1 min p.i. as shown in TAC [Figure 2]. As the tracer is cleared from the blood, the arterial activity decreased rapidly and was negligible at static (60 min p.i.) and postdiuresis (120 min p.i.) time points. Eder et al. reported that 68Ga-PSMA HBED-CC has a fast blood clearance. Our results are in concordance with the reported findings.[11]
Tracer uptake was also seen in normal bone. As shown in TAC [Figure 2], the normal bone had the highest tracer uptake at 3 min p.i. However, this tracer uptake was significantly lower than that in prostatic lesion, metastatic bone lesion, and node as well as urinary bladder, thus having no impact on visualization of target lesions. After 3 min p.i., the radioactivity cleared rapidly from normal bone, decreasing to negligible levels at 10 min. Similarly, tracer uptake in muscles remained low/negligible throughout at all time points [Table 1], thus having no impact on detection of surrounding lesions.
The interference of high urinary bladder radioactivity with detection of abdominopelvic malignancies such as PC is often a concern. Various methods to reduce the bladder radioactivity, such as administration of diuretics or voiding the bladder before scan, have been tried and reported. However, these methods do not sufficiently reduce the bladder activity.[12] Furthermore, these methods are often time-consuming making the patients noncompliant. In addition, the administration of diuretics cannot be applied to patients with renal impairment and other underlying pathology that impose a fluid intake restriction. In our study also, we have undertaken these measures of making the patient void immediately before the scan (60 min p.i.) and administering diuretics to the patients so that we could directly compare the efficacy of these methods with the proposed early dynamic imaging.
The findings of our study clearly reflect that the contrast between target lesions (prostate, bone, and/or node) and bladder is much higher on dynamic images than delayed static. Furthermore, target to nontarget contrast on dynamic images is even higher than that on postdiuretic images facilitating better delineation of target lesions.
Along with the primary prostatic lesion, all the metastatic nodal and bone lesions in the pelvis that were detected on postdiuresis image (120 min p.i.) could also be visualized on dynamic images. This is primarily attributed to the lower background radioactivity because of the initial slow accumulation of radioactivity in the urinary bladder. All the findings correlated well, histopathologically and clinically.
The early dynamic imaging proposed in this study not only enhances the contrast between the lesion and background but also saves time. Co-injection of diuretic with tracer has been suggested to save time and enhance clearance of radioactivity from the urinary bladder. However, Derlin et al. reported that the approach of co-injection of diuretic and tracer deteriorates the image quality.[13] The recent 68Ga-PSMA PET/CT imaging guidelines proposed jointly by SNMMI and EANM (2017) have advocated the administration of diuresis shortly after the tracer injection. However, at the time of inception of this study, there was no clear consensus or definite guideline for the use of diuretic or early dynamic imaging in 68Ga-PSMA-HBED-CC.[14] In view of this, we followed the approach of delayed administration of diuretic (after acquisition of 60 min static image) based on the findings of study reported by Derlin et al.[13]
In 2015, Kabasakal et al. conducted a study to evaluate the role of early imaging with 68Ga-HBED-CC (PSMA PET/CT) in patients with PC. Although dynamic imaging was not done, instead, static images were acquired at 5 min p.i. Their findings were concordant with the findings of the present study.[15] Uprimny et al. (2017) conducted a study similar to the present work. The dynamic images were acquired till 8 min p.i. study. Although the study was conducted retrospectively, our results are in agreement with their findings.[16]
Based on our results, we suggest incorporation of early dynamic imaging in routine protocol of whole-body PET/CT as it offers better delineation of the prostatic lesion as well as metastatic nodes and regional bone lesions.
Despite the encouraging results, the study is limited by small sample size. These are the initial results of an on-going study. Furthermore, the dynamic acquisition was done only till 10 min p.i. and not for longer duration. However, looking at the TACs of our study, it is expected that longer dynamic studies might not yield significantly different results. Incorporating a longer period of clinical follow-up could help in characterizing lesions even more accurately. We chose to label lesions based on a single time point uptake and CT characteristics. In the light of very recent reports of PSMA expression in nonprostatic malignancies and some benign lesions, this point needs to be considered in further studies. The promising results of our study warrant validation of the findings with a larger sample size before it can be implemented as routine clinical protocol for 68Ga-PSMA-11 PET/CT scan for PC without the need of a postdiuresis view.
Conclusion
Early dynamic imaging with 68Ga-PSMA-11 facilitates better delineation of prostatic primary lesions and metastatic lesions in the pelvis than routine whole-body images because of the considerably low radioactivity in the urinary bladder resulting in enhanced target-to-background ratio. Early dynamic image may be conducted in combination with the routine 60 min whole-body scan for better characterization and to avoid overlooking smaller lesions.
Financial support and sponsorship
Nil.
Conflicts of interest
There are no conflicts of interest.
References
- 1.Silver DA, Pellicer I, Fair WR, Heston WD, Cordon-Cardo C. Prostate-specific membrane antigen expression in normal and malignant human tissues. Clin Cancer Res. 1997;3:81–5. [PubMed] [Google Scholar]
- 2.Mhawech-Fauceglia P, Zhang S, Terracciano L, Sauter G, Chadhuri A, Herrmann FR, et al. Prostate-specific membrane antigen (PSMA) protein expression in normal and neoplastic tissues and its sensitivity and specificity in prostate adenocarcinoma: An immunohistochemical study using mutiple tumour tissue microarray technique. Histopathology. 2007;50:472–83. doi: 10.1111/j.1365-2559.2007.02635.x. [DOI] [PubMed] [Google Scholar]
- 3.Sweat SD, Pacelli A, Murphy GP, Bostwick DG. Prostate-specific membrane antigen expression is greatest in prostate adenocarcinoma and lymph node metastases. Urology. 1998;52:637–40. doi: 10.1016/s0090-4295(98)00278-7. [DOI] [PubMed] [Google Scholar]
- 4.Mannweiler S, Amersdorfer P, Trajanoski S, Terrett JA, King D, Mehes G, et al. Heterogeneity of prostate-specific membrane antigen (PSMA) expression in prostate carcinoma with distant metastasis. Pathol Oncol Res. 2009;15:167–72. doi: 10.1007/s12253-008-9104-2. [DOI] [PubMed] [Google Scholar]
- 5.Wright GL, Jr, Haley C, Beckett ML, Schellhammer PF. Expression of prostate-specific membrane antigen in normal, benign, and malignant prostate tissues. Urol Oncol. 1995;1:18–28. doi: 10.1016/1078-1439(95)00002-y. [DOI] [PubMed] [Google Scholar]
- 6.Perner S, Hofer MD, Kim R, Shah RB, Li H, Möller P, et al. Prostate-specific membrane antigen expression as a predictor of prostate cancer progression. Hum Pathol. 2007;38:696–701. doi: 10.1016/j.humpath.2006.11.012. [DOI] [PubMed] [Google Scholar]
- 7.Wright GL, Jr, Grob BM, Haley C, Grossman K, Newhall K, Petrylak D, et al. Upregulation of prostate-specific membrane antigen after androgen-deprivation therapy. Urology. 1996;48:326–34. doi: 10.1016/s0090-4295(96)00184-7. [DOI] [PubMed] [Google Scholar]
- 8.Heidenreich A, Bastian PJ, Bellmunt J, Bolla M, Joniau S, van der Kwast T, et al. EAU guidelines on prostate cancer. Part 1: Screening, diagnosis, and local treatment with curative intent-update 2013. Eur Urol. 2014;65:124–37. doi: 10.1016/j.eururo.2013.09.046. [DOI] [PubMed] [Google Scholar]
- 9.Rauscher I, Maurer T, Fendler WP, Sommer WH, Schwaiger M, Eiber M, et al. (68) Ga-PSMA ligand PET/CT in patients with prostate cancer: How we review and report. Cancer Imaging. 2016;16:14. doi: 10.1186/s40644-016-0072-6. [DOI] [PMC free article] [PubMed] [Google Scholar]
- 10.Perveen G, Arora G, Damle NA, Prabhu M, Arora S, Tripathi M, et al. Role of early dynamic positron emission tomography/computed tomography with 68Ga-prostate-specific membrane antigen-HBED-CC in patients with adenocarcinoma prostate: Initial results. Indian J Nucl Med. 2018;33:112–7. doi: 10.4103/ijnm.IJNM_8_18. [DOI] [PMC free article] [PubMed] [Google Scholar]
- 11.Eder M, Schafer M, Bauder-Wüst U, Hull WE, Wangler C, Mier W, et al. Ga68-complex lipophilicity and the targeting property of urea-based PSMA inhibitor for PET imaging. Biconjug Chem. 2012;23:688–97. doi: 10.1021/bc200279b. [DOI] [PubMed] [Google Scholar]
- 12.Rauscher I, Maurer T, Beer AJ, Graner FP, Haller B, Weirich G, et al. Value of 68Ga-PSMA HBED-CC PET for the assessment of lymph node metastases in prostate cancer patients with biochemical recurrence: Comparison with histopathology after salvage lymphadenectomy. J Nucl Med. 2016;57:1713–9. doi: 10.2967/jnumed.116.173492. [DOI] [PubMed] [Google Scholar]
- 13.Derlin T, Weiberg D, von Klot C, Wester HJ, Henkenberens C, Ross TL, et al. 68Ga-PSMA I&T PET/CT for assessment of prostate cancer: evaluation of image quality after forced diuresis and delayed imaging. Eur Radiol. 2016;26:4345–53. doi: 10.1007/s00330-016-4308-4. [DOI] [PubMed] [Google Scholar]
- 14.Fendler WP, Eiber M, Beheshti M, Bomanji J, Ceci F, Cho S, et al. 68Ga-PSMA PET/CT: Joint EANM and SNMMI procedure guideline for prostate cancer imaging: Version 1.0. Eur J Nucl Med Mol Imaging. 2017;44:1014–24. doi: 10.1007/s00259-017-3670-z. [DOI] [PubMed] [Google Scholar]
- 15.Kabasakal L, Demirci E, Ocak M, Akyel R, Nematyazar J, Aygun A, et al. Evaluation of PSMA PET/CT imaging using a 68Ga-HBED-CC ligand in patients with prostate cancer and the value of early pelvic imaging. Nucl Med Commun. 2015;36:582–7. doi: 10.1097/MNM.0000000000000290. [DOI] [PubMed] [Google Scholar]
- 16.Uprimny C, Kroiss AS, Decristoforo C, Fritz J, Warwitz B, Scarpa L, et al. Early Early dynamic imaging in 68Ga- PSMA-11 PET/CT allows discrimination of urinary bladder activity and prostate cancer lesions. Eur J Nucl Med Mol Imaging. 2017;44:765–75. doi: 10.1007/s00259-016-3578-z. [DOI] [PubMed] [Google Scholar]


