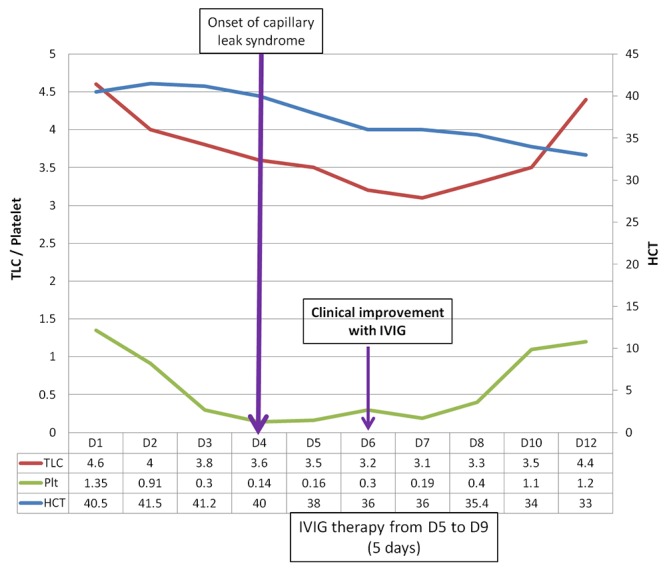
Figure 1.

Graph depicting clinical course of the patient in relation to intravenous immunoglobulin (IVIG) therapy. The x-axis shows the days of hospitalisation. Primary y-axis (left) is for platelets (×1010/L) and total leucocyte count (×109/L) and secondary y-axis (right) for haematocrit. Patient was given IVIG after onset of capillary leak syndrome and he started improving from day 2 of IVIG therapy.
