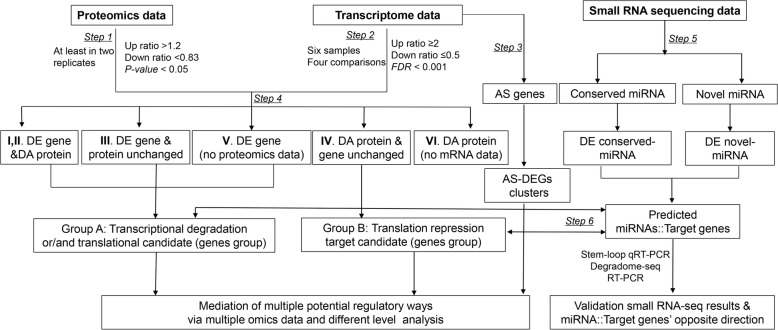
Fig. 1.
Schematic overview of proteomic and transcriptomic data generation and analysis workflow. Step 1: differential expression analysis of proteomic and Step 2: differential expression analysis of mRNA-seq data. Step 3: AS (alternative splicing) analysis using TopHat software and alternatively spliced differentially expressed genes (AS-DEGs) were obtained. Step 4: mapping of all proteins from the proteomic to mRNA-seq data and output of the two target groups. Among them, Group A contains translation repression and/or transcriptional degradation targets (contains differentially expressed genes and proteins whose levels were unchanged, both genes and proteins that were differentially expressed or no proteomic data). Group B contains potential targets of miRNA translational repression (differentially abundant proteins whose mRNA did not change or no mRNA data). Step 5: genome-wide analysis of differentially expressed conserved and novel miRNAs in both cotton genotypes under control and salt stress conditions. Step 6: psRNATarget analysis of both groups against miRNAs DE in the opposite direction combined with Group A and B data

