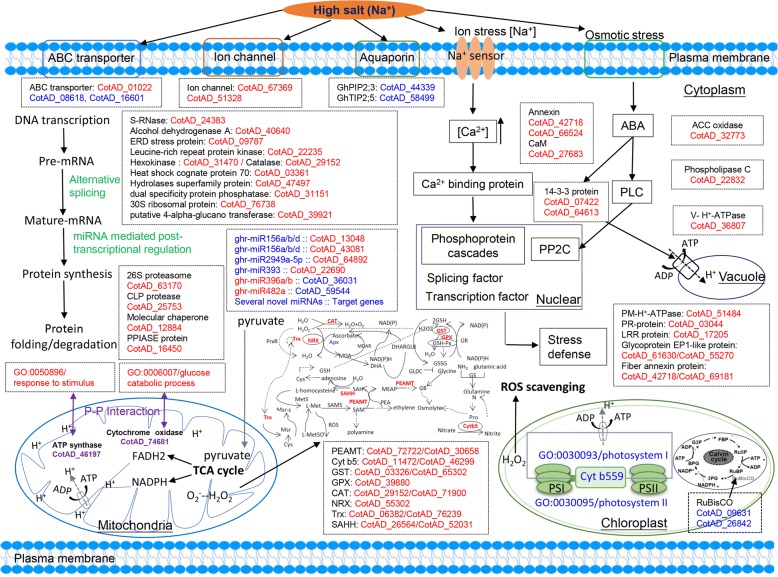
Fig. 8.
Schematic presentation of a plausible comprehensive salt-response and defence model in salt-tolerant genotypes. Most key DAPs (differentially abundant proteins) and DEGs (differentially expressed genes) as well as differentially expressed miRNAs are integrated with dotted boxes and indicated in red (up-regulated after 4 h and/or 24 h of NaCl treatment relative to their expression in control samples) or blue (down-regulated), respectively. In the mitochondria, the two core proteins, ATP synthase (CotAD_74681) and cytochrome oxidase (CotAD_46197), are associated with interactions with proteins involved in response to stimuli. Glucose catabolic processes are represented by purple font. All information concerning these proteins, genes and miRNAs that were differentially expressed under salt stress can be found in Additional files 5, 6 and 7

