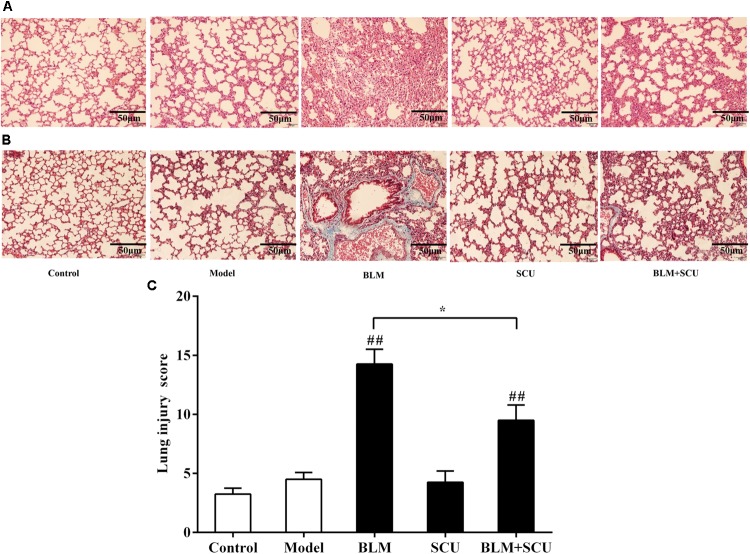
FIGURE 5.
Effects of SCU attenuated BLM-induced lung fibrosis. Lung tissue sections were stained with hematoxylin–eosin (HE) staining (A) for pathological observation (×200), with Masson (B) for collagen deposition (×200). (C) The lung injury scores; the slides were histopathological evaluated using a semi quantitative scoring method. (a) Interstitial inflammation (score: 0–4), (b) inflammatory cell infiltration (score: 0–4), (c) congestion (score: 0–4), and (d) edema (score: 0–4). The total lung injury score was calculated by adding up the individual scores of each category. Scale bar indicates 50 μm. Data are shown as the mean ± SD. (n = 4). ##p < 0.01 compared with model group; ∗p < 0.05 compared with BLM group.

