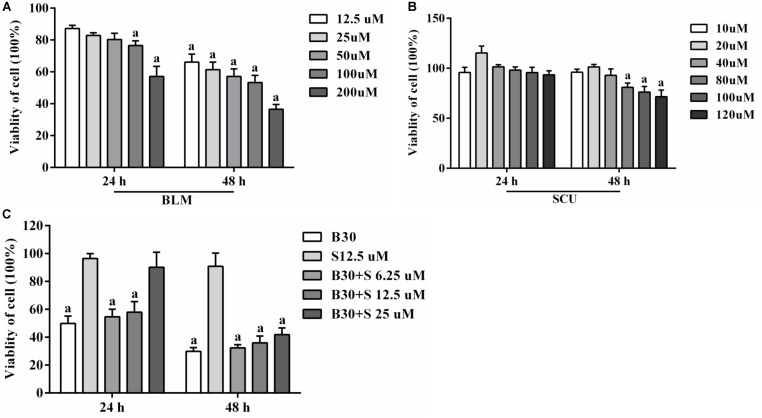
FIGURE 6.
Effects of BLM, SCU, and their combination on the viability of MRC-5 cells. (A) The viability of MRC-5 cells after 24 and 48 h treatment of BLM alone. (B) The viability of MRC-5 cells after 24 and 48 h treatment of SCU alone. (C) The viability of MRC-5 cells after 24 and 48 h treatment of BLM combined with SCU. The data of the control group were pegged as 0.0%, whereas other data were calculated relative to it. Data are shown as the mean ± SD. (n = 5). a < 0.05 compared with control group.

