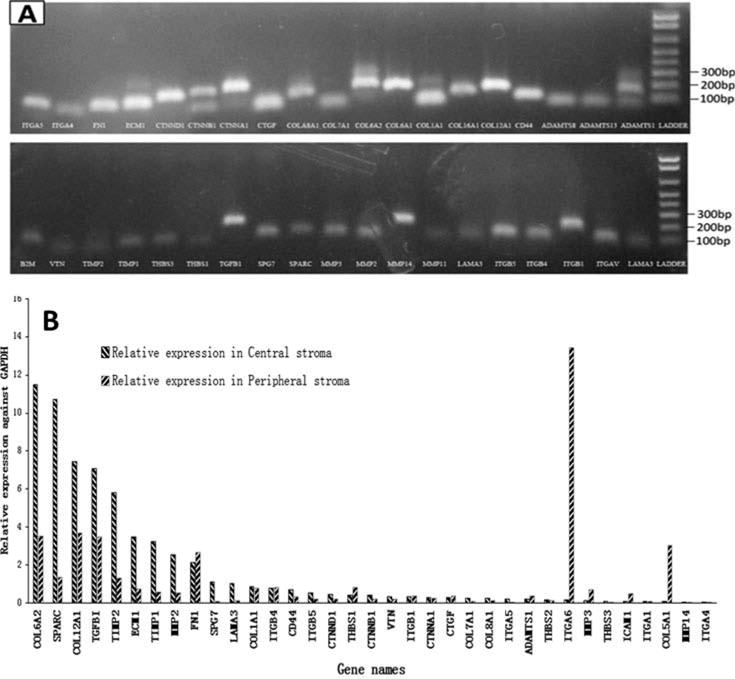
Figure 2.

Expression of ECM genes in the corneal stroma. In total, 84 key ECM genes represented in the PCR arrays were quantified by real-time PCR. The specificity of primers was monitored with melting curves. (a) The PCR products were resolved in agarose gel and stained by ethidium bromide dye, further indicating the specificity of primers and PCR products. (b) The histogram showed the relative expression of 35 ECM genes in both central and peripheral stroma, respectively. GAPDH served as a control gene for normalization.
