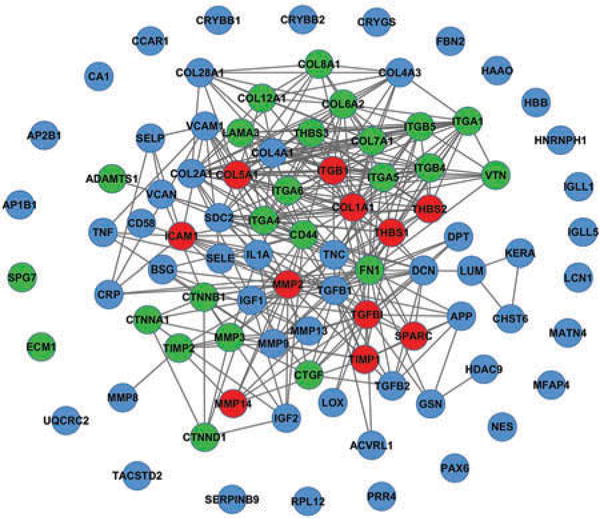
Figure 4.

Functional association network of ECM genes in cornea. The string and Cytoscape programs were applied to model the functional association of the stroma ECM genes that were identified in the present study and from the literatures. Red nodes represent the ECM genes that were found in both literatures and our study to be expressed by stromal keratocytes and present in the core cluster. Blue nodes represent known ECM genes that were exclusively obtained from published literatures. Green nodes represent novel ECM genes that we identified in this study. Gray lines indicated that the connected gene pair may involve in common biological process (confidence score >0.8). Functional associations are extracted from STRING database. This figure is produced by Cytoscape software.
