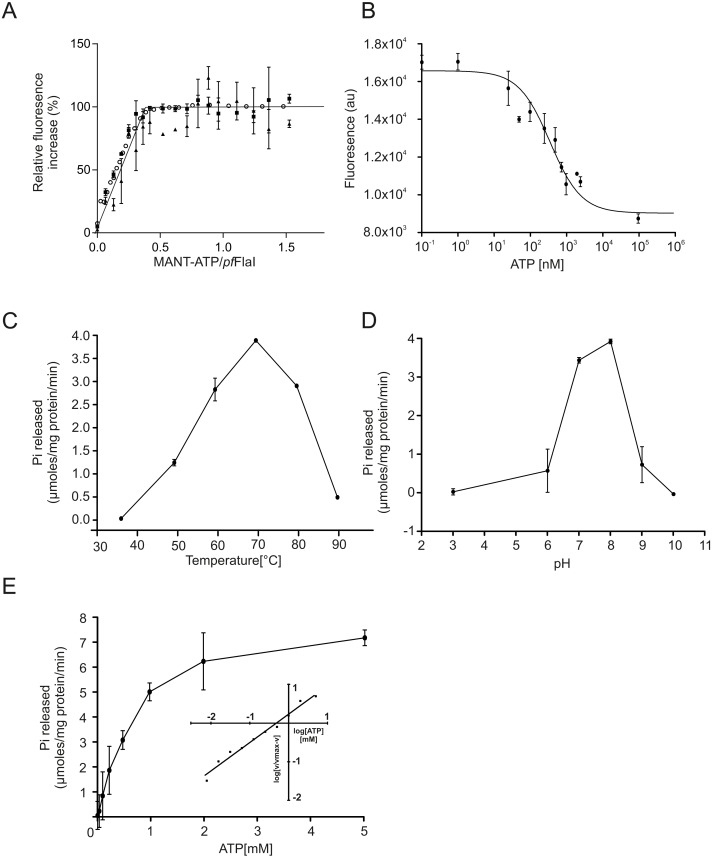
Figure 3. ATP binding and hydrolysis of PfFlaI.
(A) Fluorescence increase at increasing concentrations of MANT-ATP upon addition of 20 nM, 100 nM and 5 µM PfFlaI. Lines depict the linear fits of the two observed phases. The lines cross at a MANT-ATP concentration of 1.7 µM. (B) Total fluorescence after addition of increasing amounts of ATP to a solution containing 20 nM PfFlaI and 10 nM of MANT-ATP. The data were fitted with the Hill equation: resulting in a best fit (R2 = 0.98) with IC50 = 260 nM and n = 0.67. (C, D) ATP hydrolysis by 12.5 µg/ml PfFlaI at different temperatures and at different pHs respectively. (E) ATPase activity of PfFlaI at different ATP concentrations. The curve was fitted to the Michaelis-Menten equation (V = Vmax∗[ATP]∕(Km + [ATP])), resulting in a Km of 580 nM. The inset shows the same data plotted according to the Hill equation (Hill coefficient = 0.9). Experiments were performed with at least two biological and three technical replicates. Error bars depict the standard error obtained from the technical replicates.

