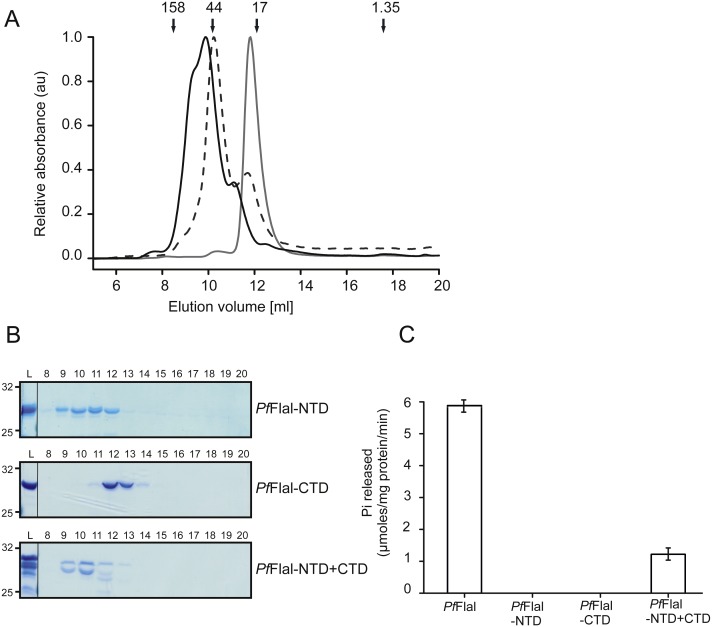
Figure 4. Analysis of the interaction between the N- and C-terminal domains of PfFlaI.
(A) Relative absorbance at 280 nm of size exclusion chromatography at 280 nm of size exclusion chromatography of PfFlaI-NTD (black line), PfFlaI-CTD (grey line) or a stoichiometric mixture of PfFlaI-NTD and PfFlaI-CTD (dashed line) using Superdex 75 10/300GL column. Elution positions of molecular mass standards (kDa) are indicated with arrows. (B) SDS-PAGE analysis of the elution fractions described in A. (C) ATPase activity at 70 °C of the main elution fraction after size exclusion chromatography of PfFlaI, PfFlaI-NTD, PfFlaI-CTD and the stoichiometric mixture of PfFlaI-NTD and PfFlaI-CTD at a concentration of 12.5 µg/ml. For A and B, a representative experiment is shown. For C, graph shows the average of two biological replicates with two technical replicates.

