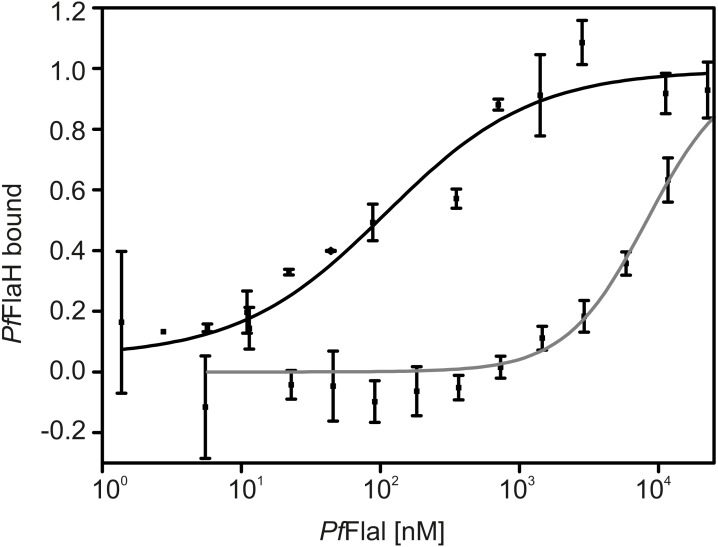
Figure 6. PfFlaH interacts with higher affinity with PfFlaI-CTD than PfFlaI-NTD.
The binding of 28 nM fluorescently labeled Pf FlaH to increasing concentrations of 1.4 nM–22.5 µM for PfFlaI-CTD (black) and 5.7 nM–11.7 µM for PfFlaI-NTD (grey) was studied by microscale thermophoresis. Binding is depicted as the fraction bound and binding curves were fitted to the Hill equation. Curves were obtained from at least two independent experiments.

